
- Home >
- Stock Photos >
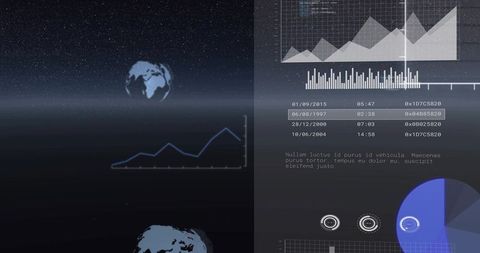
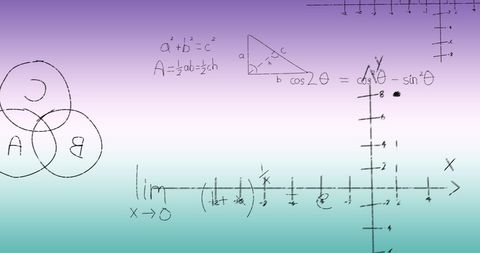
- Data Analytics and Visualization on Digital Chalkboard
Data Analytics and Visualization on Digital Chalkboard Image

This design combines elements of mathematics and data analytics on a virtual chalkboard. Perfect for presentations or educational material that aims to merge analytical reasoning with educational technology. Useful in illustrating scientific concepts, displaying statistical data, or providing a visual aid for academic lectures.
Powered by 


downloads
Tags:
More
Credit Photo
If you would like to credit the Photo, here are some ways you can do so
Text Link
photo Link
<span class="text-link">
<span>
<a target="_blank" href=https://pikwizard.com/photo/data-analytics-and-visualization-on-digital-chalkboard/95b02207d3d68b21285db88b03701fc8/>PikWizard</a>
</span>
</span>
<span class="image-link">
<span
style="margin: 0 0 20px 0; display: inline-block; vertical-align: middle; width: 100%;"
>
<a
target="_blank"
href="https://pikwizard.com/photo/data-analytics-and-visualization-on-digital-chalkboard/95b02207d3d68b21285db88b03701fc8/"
style="text-decoration: none; font-size: 10px; margin: 0;"
>
<img src="https://pikwizard.com/pw/medium/95b02207d3d68b21285db88b03701fc8.jpg" style="margin: 0; width: 100%;" alt="" />
<p style="font-size: 12px; margin: 0;">PikWizard</p>
</a>
</span>
</span>
Free (free of charge)
Free for personal and commercial use.
Author: Authentic Images
Similar Free Stock Images

Premium


Premium

Premium


Premium


Premium

Premium


Premium


Premium

Premium


Premium


Premium

Premium


Premium


Premium

Premium

Premium

Premium


Premium


Premium


Premium


Premium


Premium


Premium


Premium

Premium


Explore More Free Stock Images