- Home >
- Stock Photos >
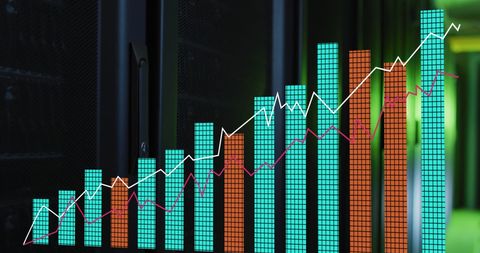
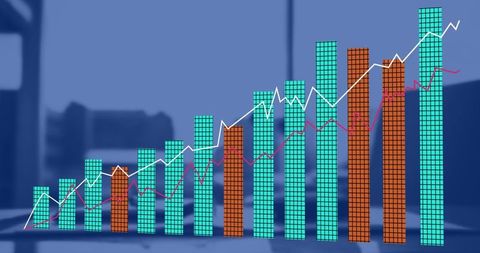
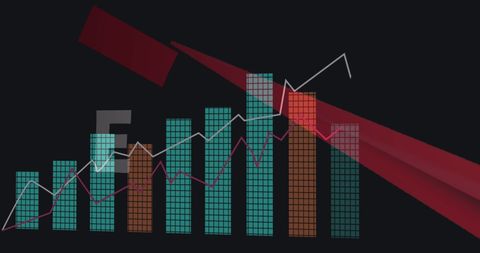
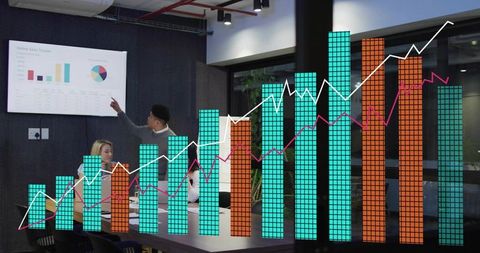
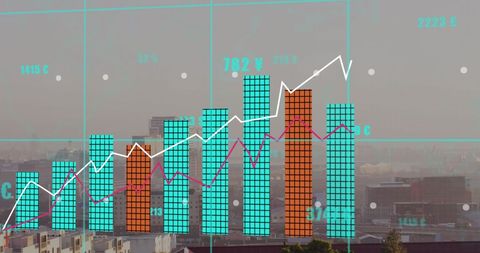
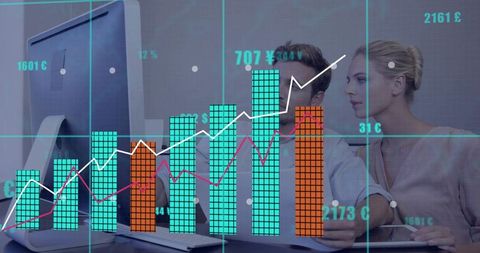
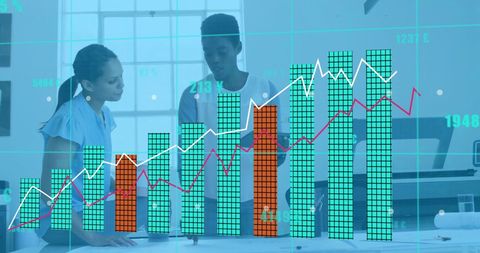
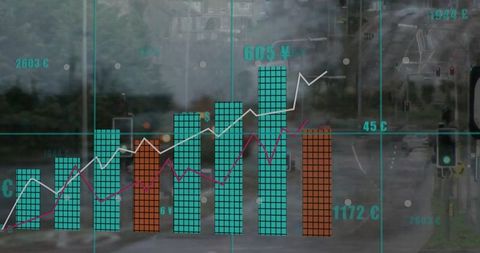
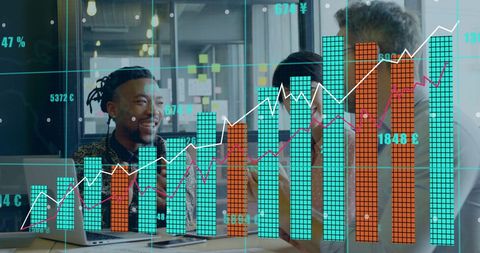
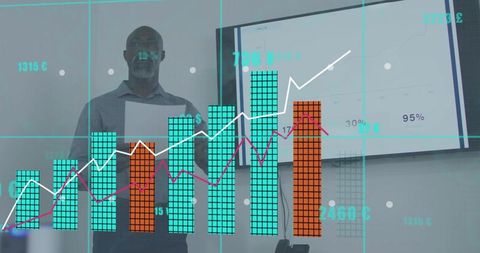
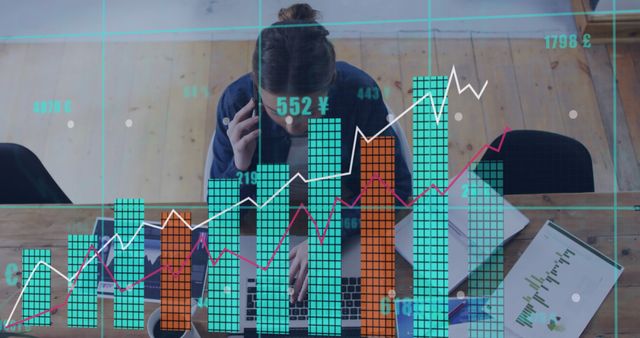
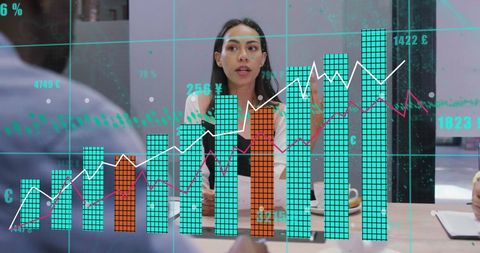
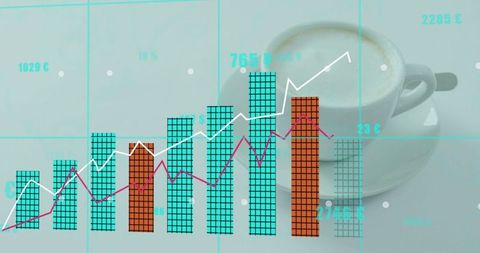
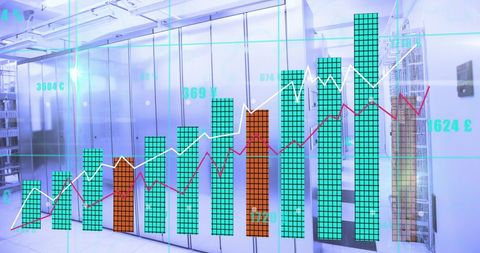
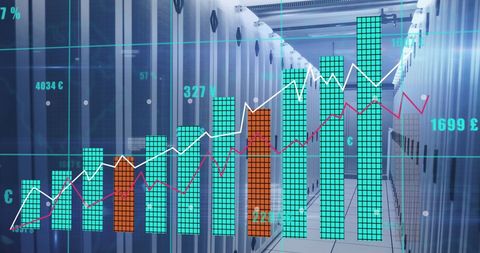
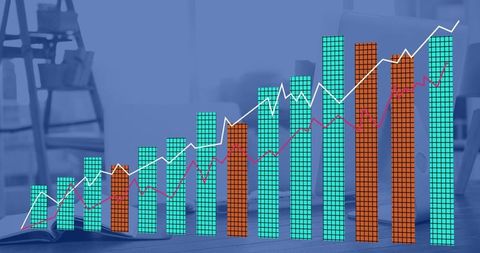
- Data Analytics Concept with Bar Graph and Rising Trend Line
Data Analytics Concept with Bar Graph and Rising Trend Line Image
Illustration showing colorful bar graph, rising trend line overdesk with a digital and statistical theme on blue background. Suitable for conveying themes of business data analysis, financial growth, technological advancement. Ideal for use in presentations, reports, blogs focused on global business dynamics, cloud computing, or digital transformation.

downloads
Tags:
More
Credit Photo
If you would like to credit the Photo, here are some ways you can do so
Text Link
photo Link
<span class="text-link">
<span>
<a target="_blank" href=https://pikwizard.com/photo/data-analytics-concept-with-bar-graph-and-rising-trend-line/7fca72b714534e5b1f13a3c19a188269/>PikWizard</a>
</span>
</span>
<span class="image-link">
<span
style="margin: 0 0 20px 0; display: inline-block; vertical-align: middle; width: 100%;"
>
<a
target="_blank"
href="https://pikwizard.com/photo/data-analytics-concept-with-bar-graph-and-rising-trend-line/7fca72b714534e5b1f13a3c19a188269/"
style="text-decoration: none; font-size: 10px; margin: 0;"
>
<img src="https://pikwizard.com/pw/medium/7fca72b714534e5b1f13a3c19a188269.jpg" style="margin: 0; width: 100%;" alt="" />
<p style="font-size: 12px; margin: 0;">PikWizard</p>
</a>
</span>
</span>
Free (free of charge)
Free for personal and commercial use.
Author: People Creations