
- Home >
- Stock Photos >
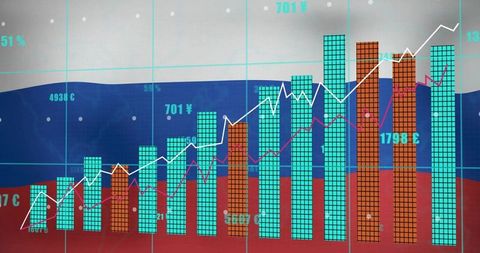
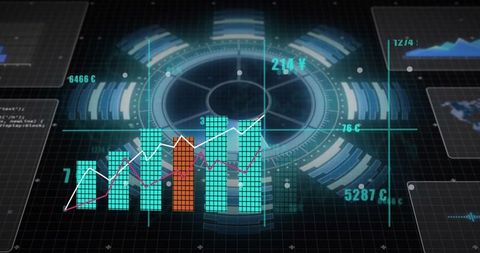
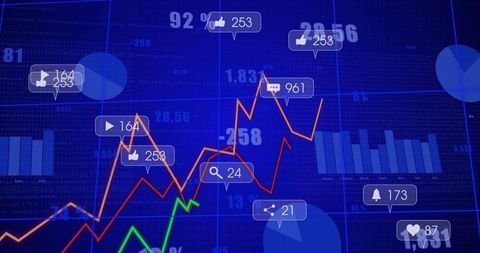
- Data Analytics Concept with Financial Growth Chart in Digital Interface
Data Analytics Concept with Financial Growth Chart in Digital Interface Image

This stock media portrays a futuristic data analytics concept with turquoise and orange bar charts alongside white and red trend lines. Ideal for presentations about financial growth and technology-driven investments. Useful for illustrating themes in finance, analytics, and business intelligence.
Powered by 


downloads
Tags:
More
Credit Photo
If you would like to credit the Photo, here are some ways you can do so
Text Link
photo Link
<span class="text-link">
<span>
<a target="_blank" href=https://pikwizard.com/photo/data-analytics-concept-with-financial-growth-chart-in-digital-interface/e436b2c9004bf3c7c2d7f1a2a2bec748/>PikWizard</a>
</span>
</span>
<span class="image-link">
<span
style="margin: 0 0 20px 0; display: inline-block; vertical-align: middle; width: 100%;"
>
<a
target="_blank"
href="https://pikwizard.com/photo/data-analytics-concept-with-financial-growth-chart-in-digital-interface/e436b2c9004bf3c7c2d7f1a2a2bec748/"
style="text-decoration: none; font-size: 10px; margin: 0;"
>
<img src="https://pikwizard.com/pw/medium/e436b2c9004bf3c7c2d7f1a2a2bec748.jpg" style="margin: 0; width: 100%;" alt="" />
<p style="font-size: 12px; margin: 0;">PikWizard</p>
</a>
</span>
</span>
Free (free of charge)
Free for personal and commercial use.
Author: People Creations
Similar Free Stock Images
Premium


Premium

Premium


Premium


Premium


Premium

Premium


Premium


Premium


Premium


Premium


Premium


Premium

Premium

Premium


Premium


Premium


Premium


Premium


Premium


Premium

Premium


Premium


Premium


Premium

Explore More Free Stock Images