- Home >
- Stock Photos >
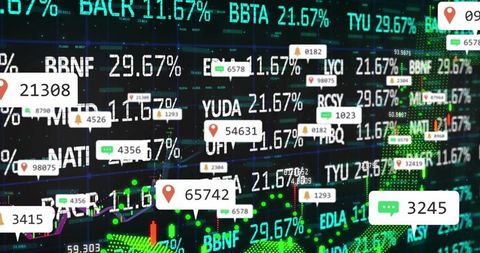
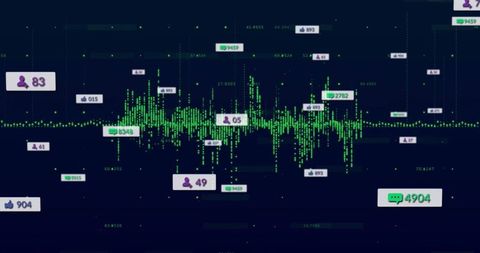
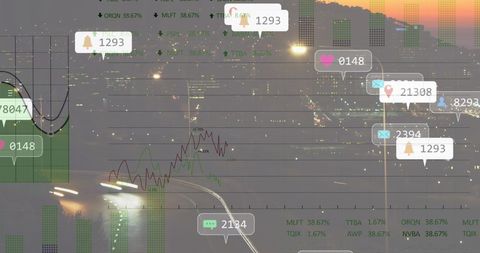
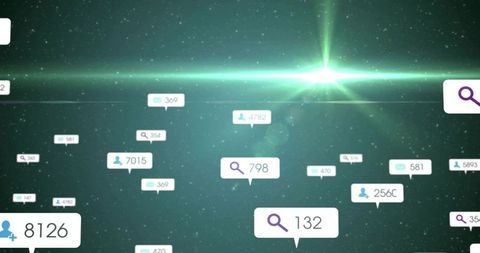
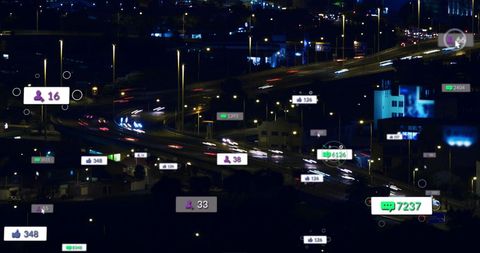
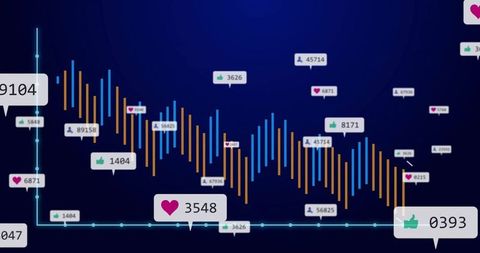
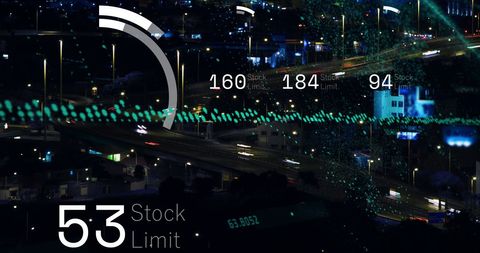
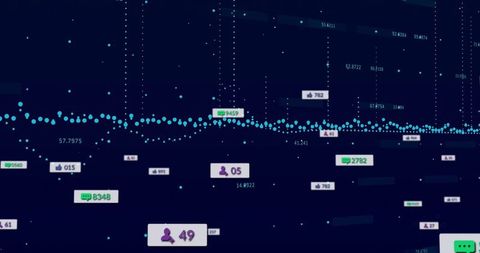
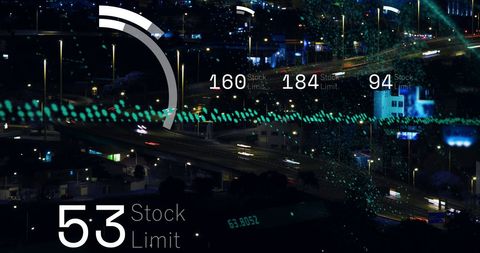
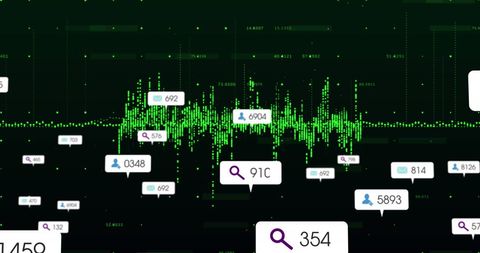
- Data Analytics Dashboard Interface with Floating Numerical Labels
Data Analytics Dashboard Interface with Floating Numerical Labels Image

A futuristic display illustrating data analytics concepts with numerical labels against a dark interface, incorporating search, user, and envelop icons. This can be used to depict modern technology in data management presentations, analytical report templates, and business intelligence marketing materials to highlight advanced data processing capabilities and user interaction.

downloads
Tags:
More
Credit Photo
If you would like to credit the Photo, here are some ways you can do so
Text Link
photo Link
<span class="text-link">
<span>
<a target="_blank" href=https://pikwizard.com/photo/data-analytics-dashboard-interface-with-floating-numerical-labels/aa93c9ab426744775b3c7ca629e76310/>PikWizard</a>
</span>
</span>
<span class="image-link">
<span
style="margin: 0 0 20px 0; display: inline-block; vertical-align: middle; width: 100%;"
>
<a
target="_blank"
href="https://pikwizard.com/photo/data-analytics-dashboard-interface-with-floating-numerical-labels/aa93c9ab426744775b3c7ca629e76310/"
style="text-decoration: none; font-size: 10px; margin: 0;"
>
<img src="https://pikwizard.com/pw/medium/aa93c9ab426744775b3c7ca629e76310.jpg" style="margin: 0; width: 100%;" alt="" />
<p style="font-size: 12px; margin: 0;">PikWizard</p>
</a>
</span>
</span>
Free (free of charge)
Free for personal and commercial use.
Author: Authentic Images