
- Home >
- Stock Photos >
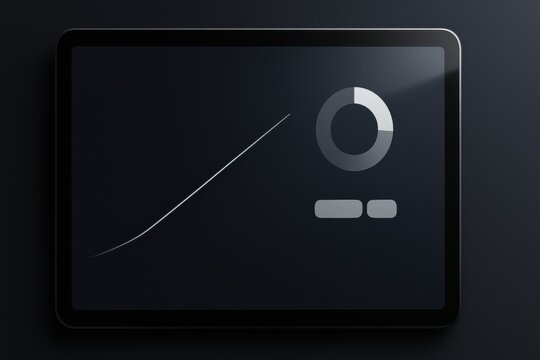
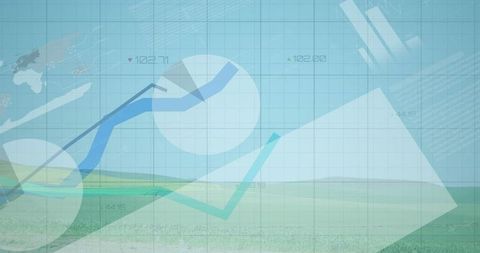
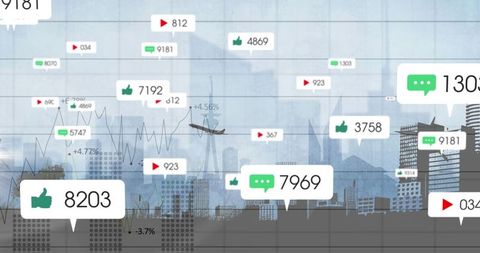
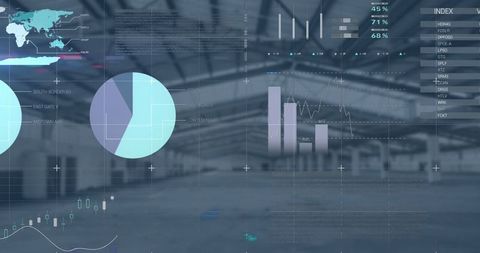
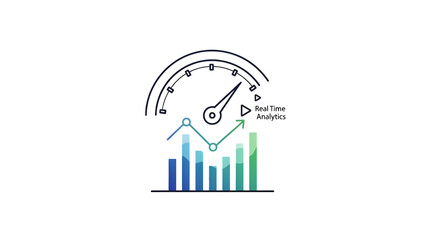
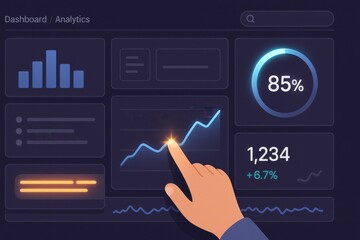
- Data Analytics Dashboard with Chart and Notifications
Data Analytics Dashboard with Chart and Notifications Image

This visualization depicts a dynamic data analytics dashboard showing trend lines and notifications, ideal for representing business performance and technological innovation. Suitable for business presentations, tech articles, or digital marketing materials highlighting advancements in data management and interface design. The convergence of data points and digital interface elements emphasizes ongoing innovation and strategic insights.
Powered by 


downloads
Tags:
More
Credit Photo
If you would like to credit the Photo, here are some ways you can do so
Text Link
photo Link
<span class="text-link">
<span>
<a target="_blank" href=https://pikwizard.com/photo/data-analytics-dashboard-with-chart-and-notifications/f42bf03355c180353905bdd286316c53/>PikWizard</a>
</span>
</span>
<span class="image-link">
<span
style="margin: 0 0 20px 0; display: inline-block; vertical-align: middle; width: 100%;"
>
<a
target="_blank"
href="https://pikwizard.com/photo/data-analytics-dashboard-with-chart-and-notifications/f42bf03355c180353905bdd286316c53/"
style="text-decoration: none; font-size: 10px; margin: 0;"
>
<img src="https://pikwizard.com/pw/medium/f42bf03355c180353905bdd286316c53.jpg" style="margin: 0; width: 100%;" alt="" />
<p style="font-size: 12px; margin: 0;">PikWizard</p>
</a>
</span>
</span>
Free (free of charge)
Free for personal and commercial use.
Author: Authentic Images
Similar Free Stock Images

Premium


Premium


Premium


Premium


Premium


Premium

Premium

Premium


Premium


Premium
Premium


Premium


Premium


Premium

Premium

Premium


Premium


Premium


Premium


Premium


Premium


Premium


Premium
Premium


Premium


Explore More Free Stock Images