
- Home >
- Stock Photos >
- Data Analytics Dashboard with Currency Markers Visualizing Financial Trends
Data Analytics Dashboard with Currency Markers Visualizing Financial Trends Image
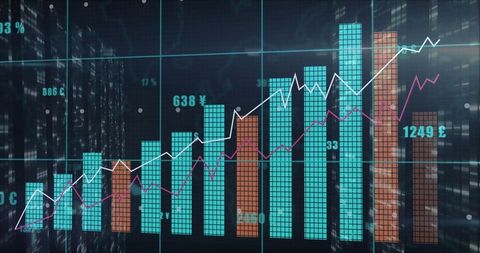
Illustrating complex financial data, the featured dashboard showcases dynamic graphs and currency symbols to represent market trends. The blend of vibrant bar charts and rising lines is perfect for presentations, reports on financial forecasts, business growth analytics, and educational tools for illustrating statistical analyses. Useful for businesses in need of detailed displays of market ecosystems and currency-focused investments.

downloads
Tags:
More
Credit Photo
If you would like to credit the Photo, here are some ways you can do so
Text Link
photo Link
<span class="text-link">
<span>
<a target="_blank" href=https://pikwizard.com/photo/data-analytics-dashboard-with-currency-markers-visualizing-financial-trends/12857e873e8d3a2a60a1d01f52375404/>PikWizard</a>
</span>
</span>
<span class="image-link">
<span
style="margin: 0 0 20px 0; display: inline-block; vertical-align: middle; width: 100%;"
>
<a
target="_blank"
href="https://pikwizard.com/photo/data-analytics-dashboard-with-currency-markers-visualizing-financial-trends/12857e873e8d3a2a60a1d01f52375404/"
style="text-decoration: none; font-size: 10px; margin: 0;"
>
<img src="https://pikwizard.com/pw/medium/12857e873e8d3a2a60a1d01f52375404.jpg" style="margin: 0; width: 100%;" alt="" />
<p style="font-size: 12px; margin: 0;">PikWizard</p>
</a>
</span>
</span>
Free (free of charge)
Free for personal and commercial use.
Author: People Creations