- Home >
- Stock Photos >
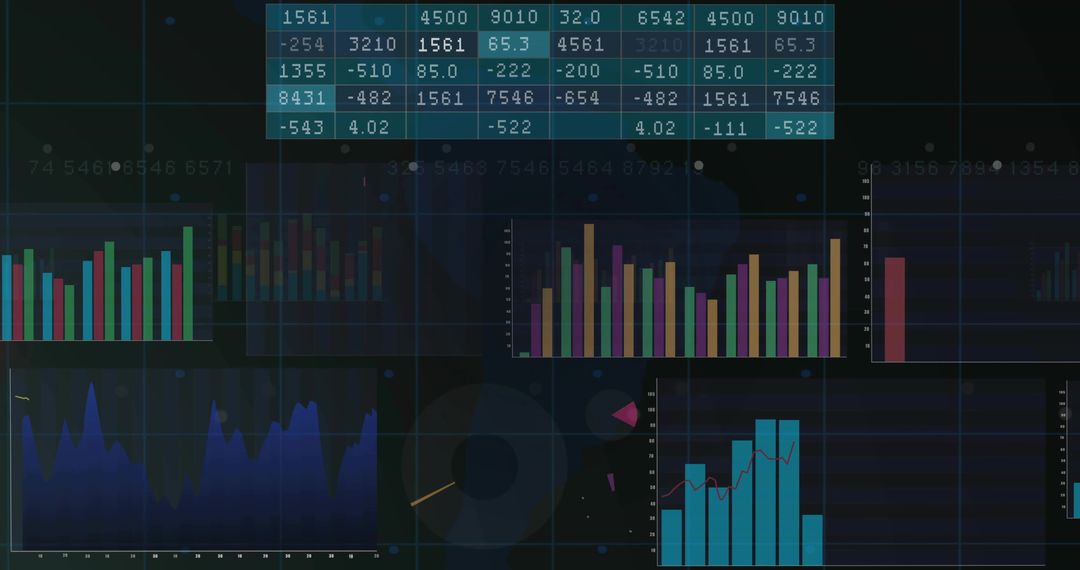
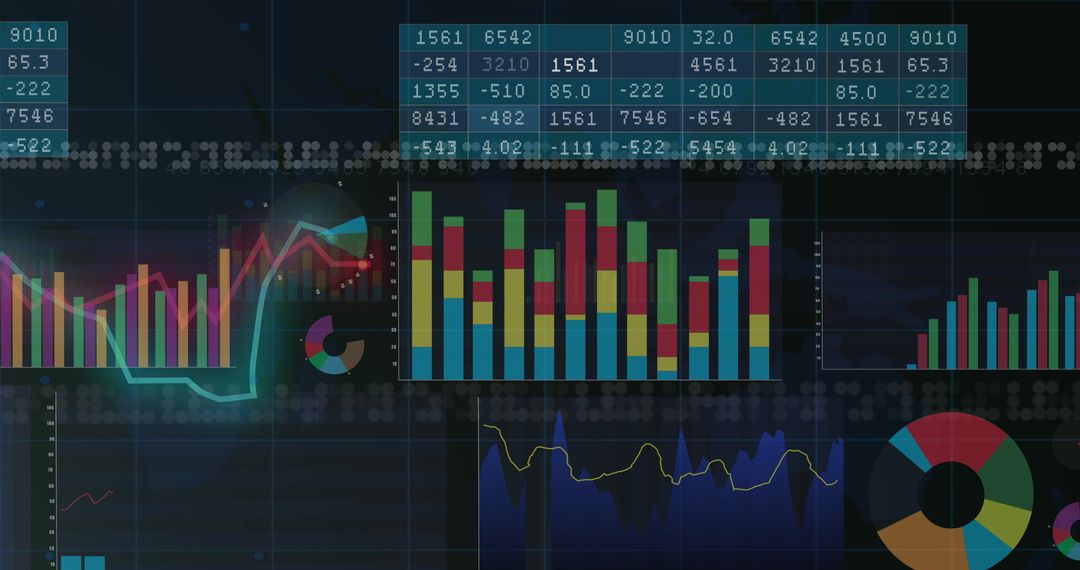
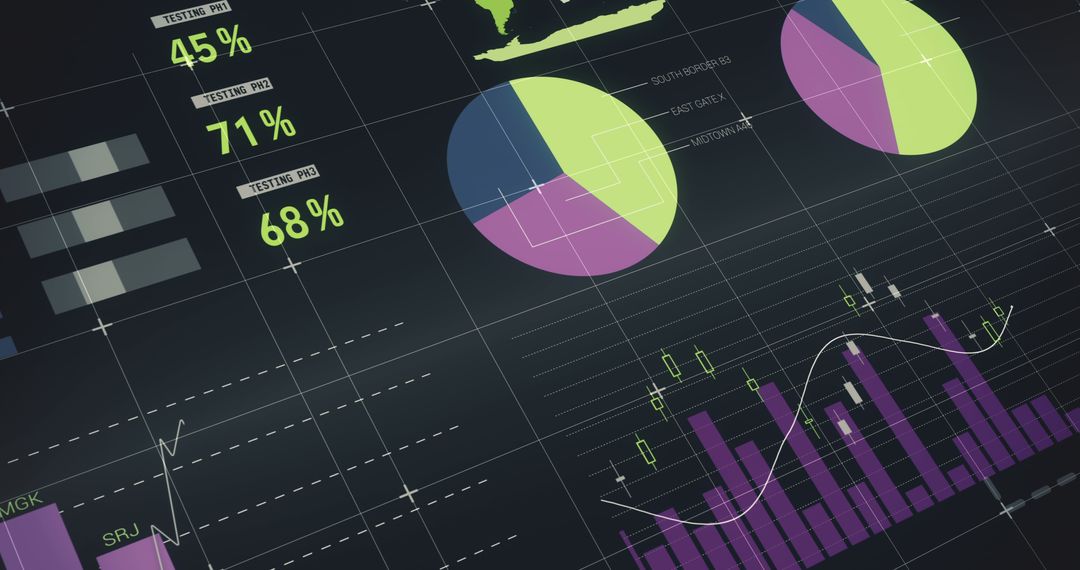
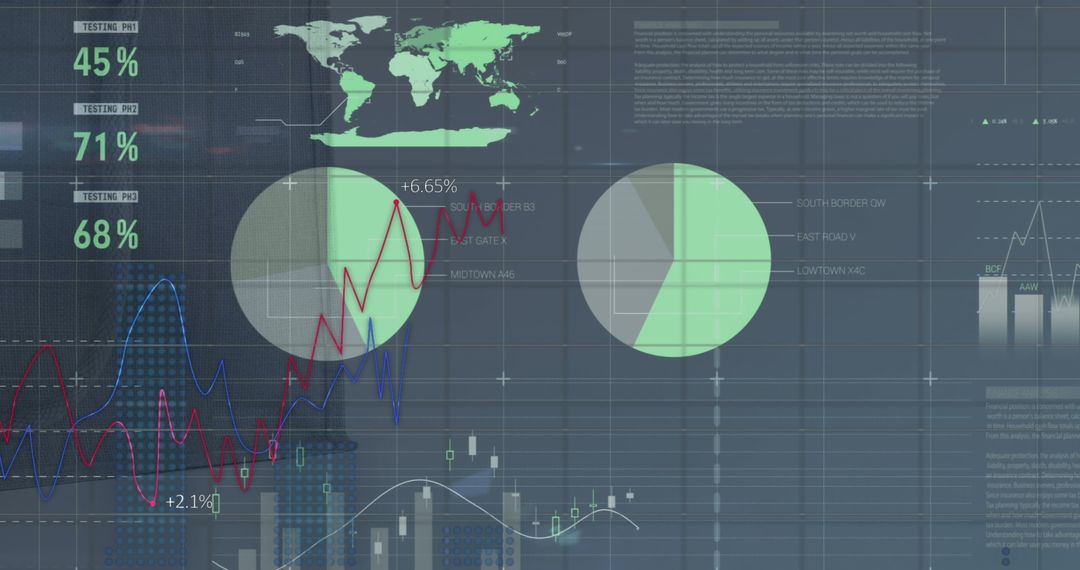
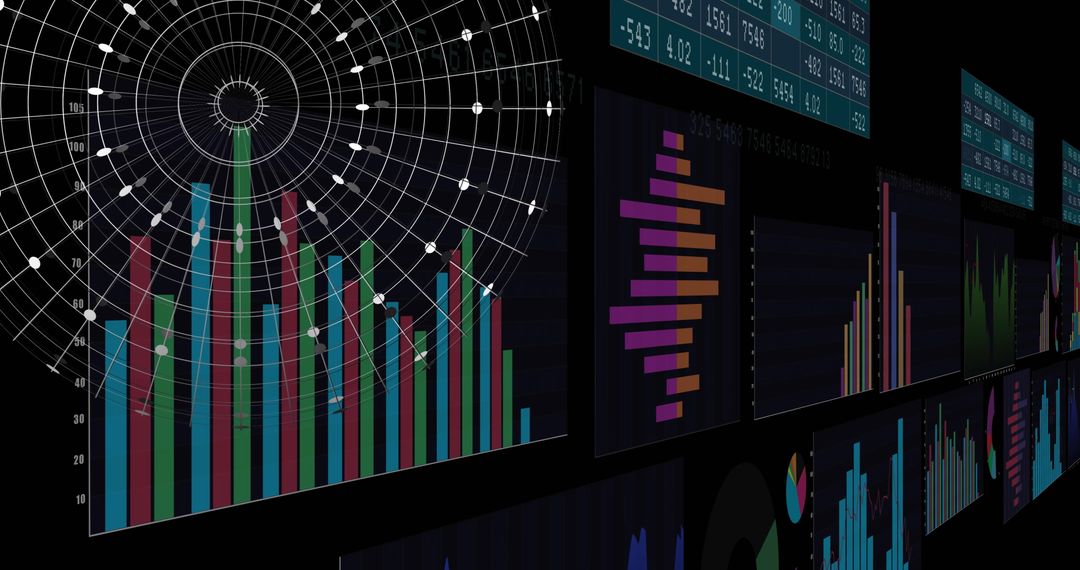
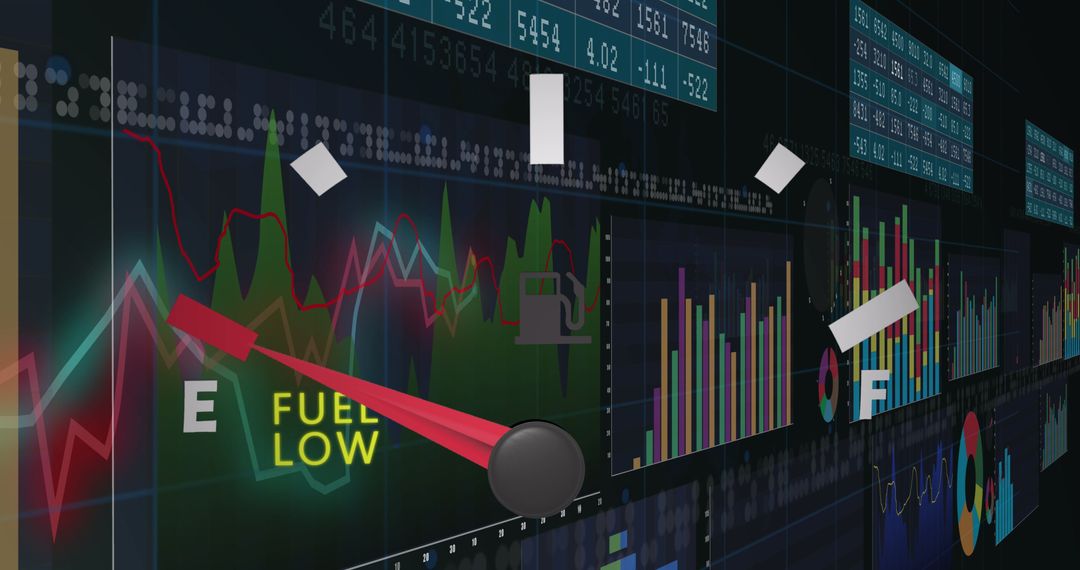
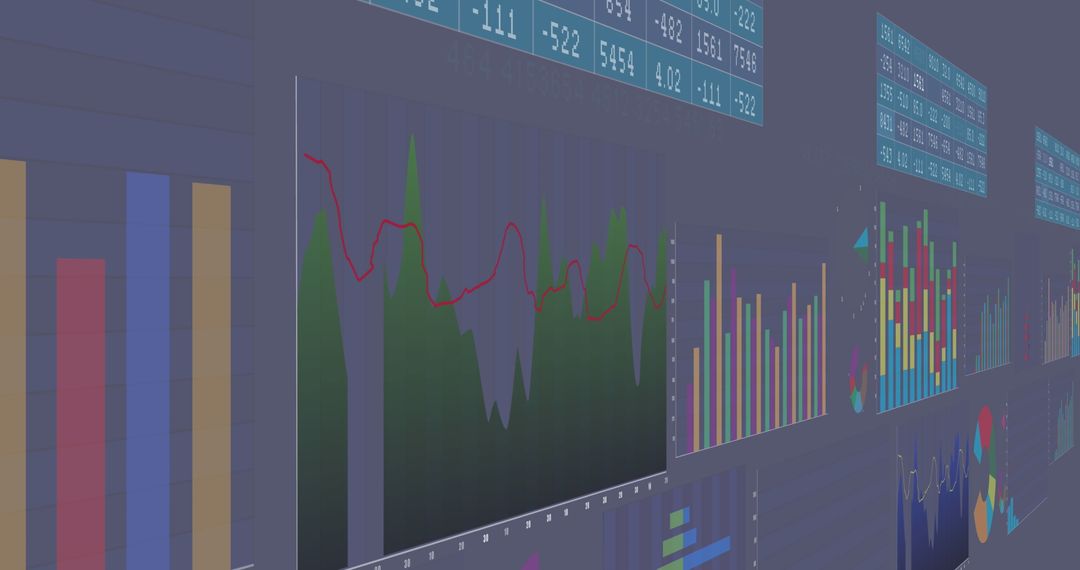
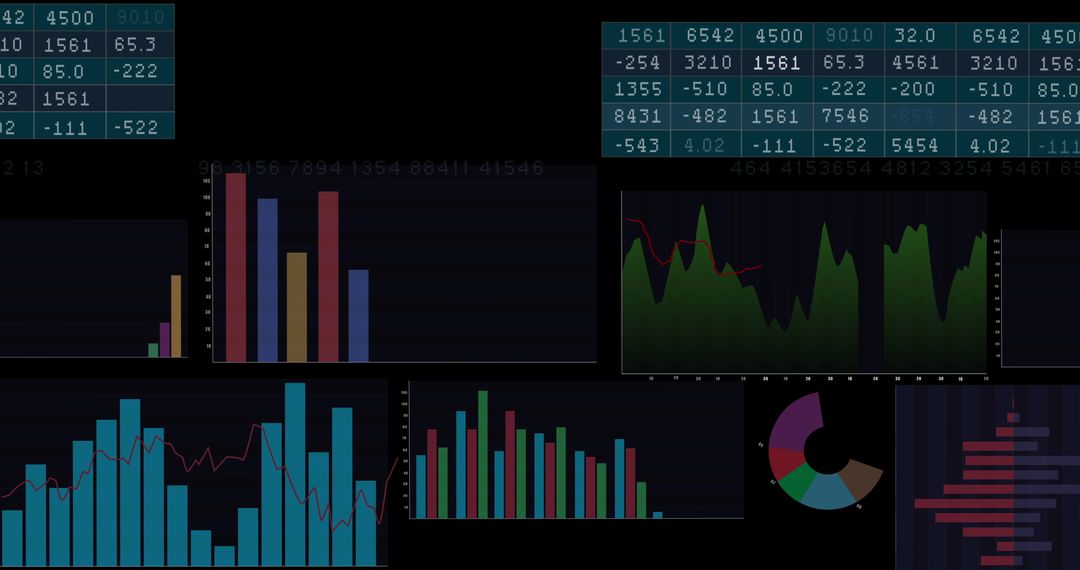
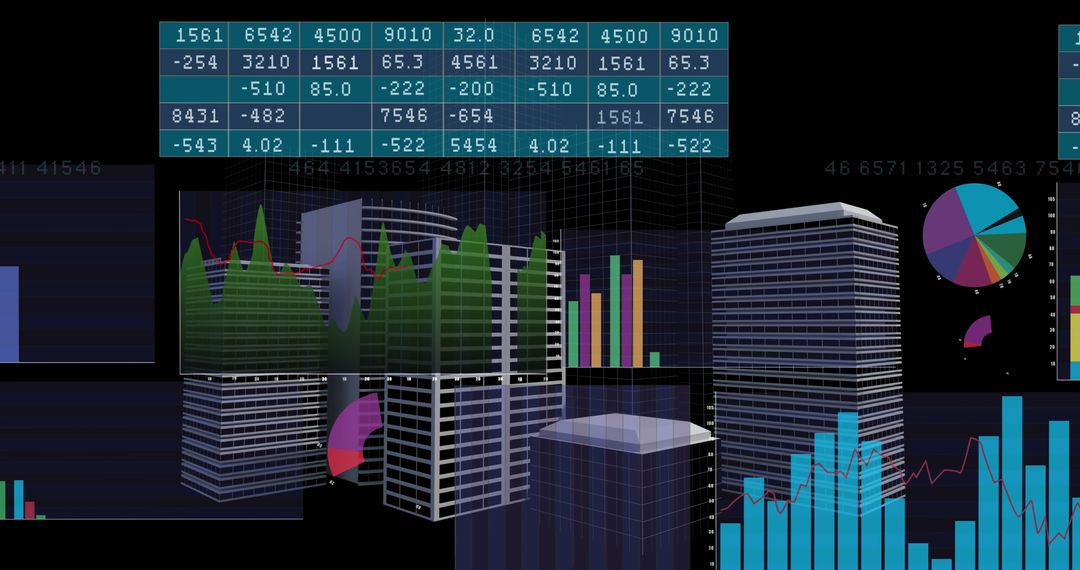
- Data Analytics Dashboard with Dynamic Charts and Graphs
Data Analytics Dashboard with Dynamic Charts and Graphs Image

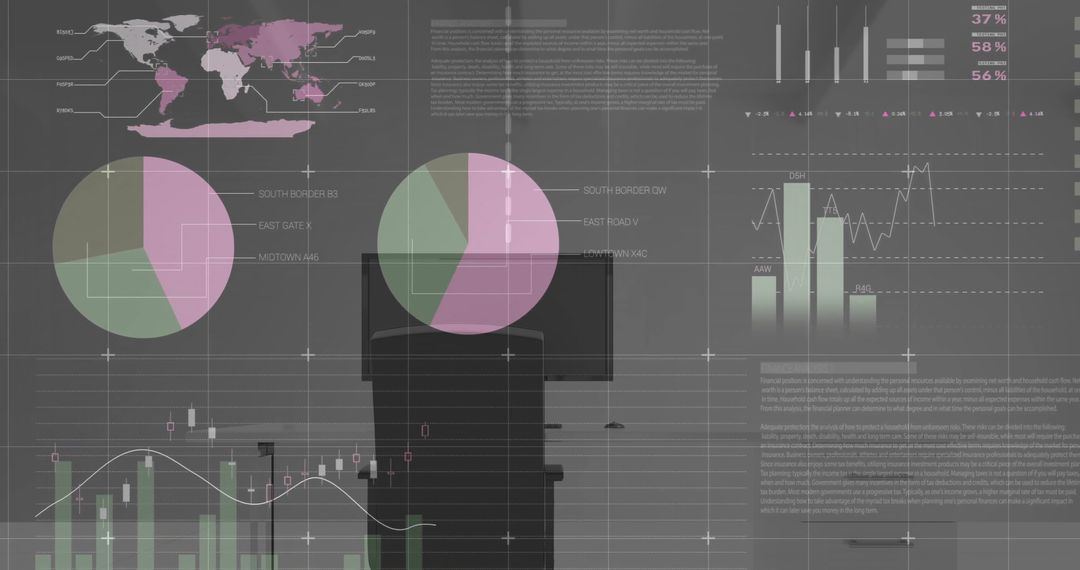
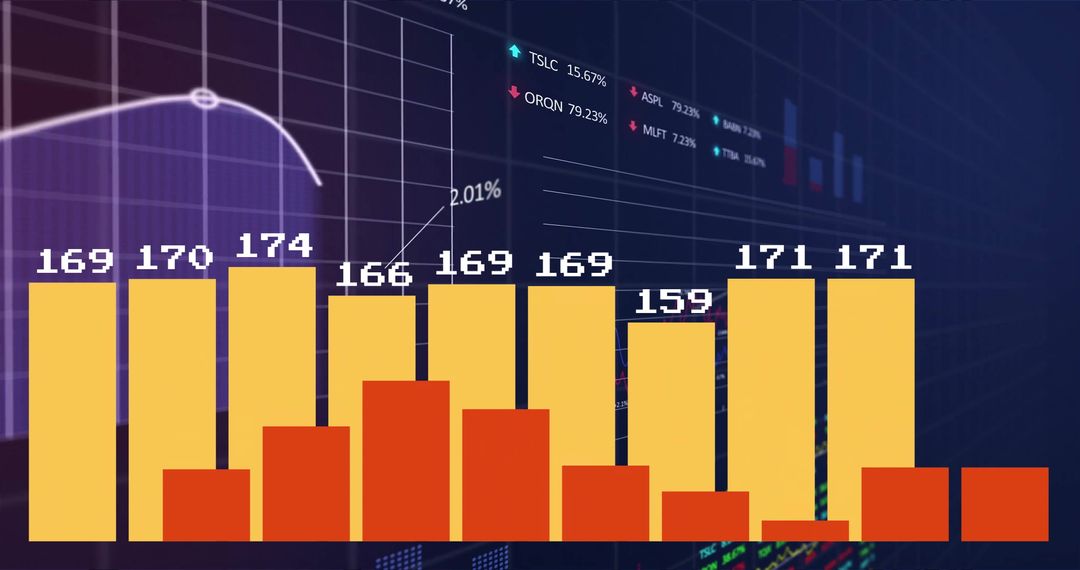
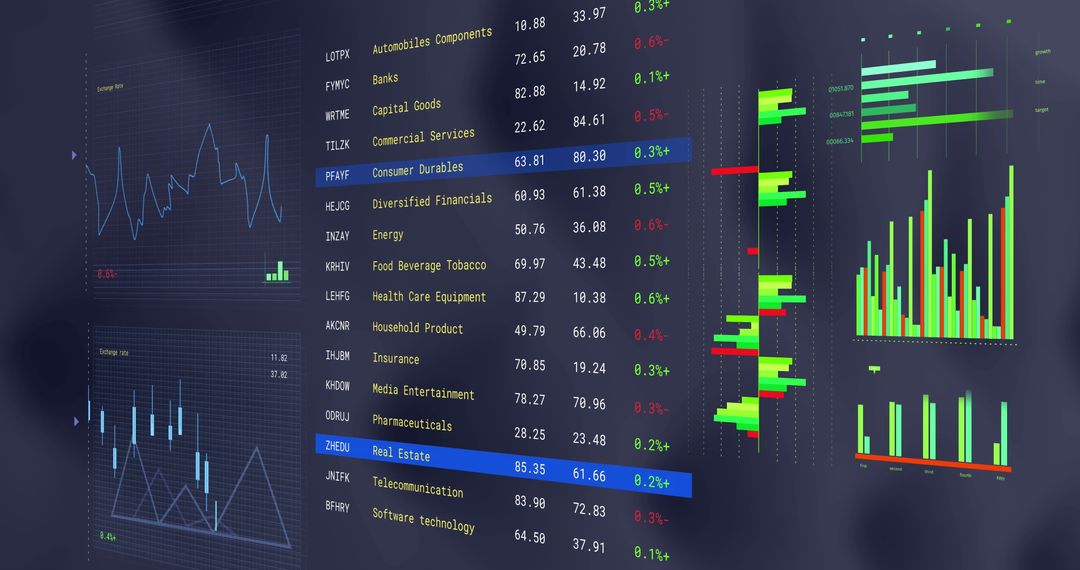
Futuristic display features multiple screens showcasing real-time data analysis with engaging visual elements such as line graphs, bar charts, and pie charts. Suitable for illustrating complex data analysis in technology and business sectors. Useful for tech presentations, financial reports, and educational materials focusing on information technology or statistical methods.
Powered by  - Get 15% off with code: PIKWIZARD15


0
downloads
downloads
Tags:
More
Credit Photo
If you would like to credit the Photo, here are some ways you can do so
Text Link
photo Link
<span class="text-link">
<span>
<a target="_blank" href=https://pikwizard.com/photo/data-analytics-dashboard-with-dynamic-charts-and-graphs/1527b6f89d1c3a4876b98f55b8c39158/>PikWizard</a>
</span>
</span>
<span class="image-link">
<span
style="margin: 0 0 20px 0; display: inline-block; vertical-align: middle; width: 100%;"
>
<a
target="_blank"
href="https://pikwizard.com/photo/data-analytics-dashboard-with-dynamic-charts-and-graphs/1527b6f89d1c3a4876b98f55b8c39158/"
style="text-decoration: none; font-size: 10px; margin: 0;"
>
<img src="https://pikwizard.com/pw/medium/1527b6f89d1c3a4876b98f55b8c39158.jpg" style="margin: 0; width: 100%;" alt="" />
<p style="font-size: 12px; margin: 0;">PikWizard</p>
</a>
</span>
</span>
Free (free of charge)
Free for personal and commercial use.
Author: Awesome Content
Similar Free Stock Images

Premium


Premium


Premium


Premium


Premium


Premium


Premium


Premium


Premium


Premium


Premium


Premium


Premium


Premium


Premium


Premium


Premium


Premium


Premium


Premium


Premium


Premium


Premium


Premium