- Home >
- Stock Photos >
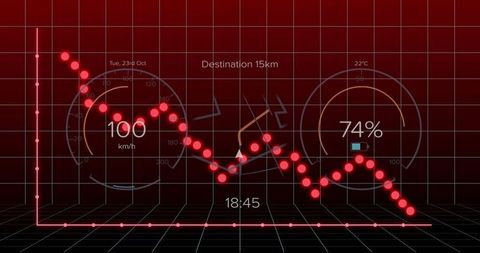
- Data Analytics Dashboard with Neon Highlights
Data Analytics Dashboard with Neon Highlights Image

The graphic displays line graphs on a digital dashboard with neon yellow highlights accentuating specific areas. Percentage labels indicate performance metrics and trends. Ideal for materials focusing on data analysis, statistical evaluations, cutting-edge technology presentations, and demonstrating positive business progress.

downloads
Tags:
More
Credit Photo
If you would like to credit the Photo, here are some ways you can do so
Text Link
photo Link
<span class="text-link">
<span>
<a target="_blank" href=https://pikwizard.com/photo/data-analytics-dashboard-with-neon-highlights/11d01514a98878d5a1ce83eadb24c5fe/>PikWizard</a>
</span>
</span>
<span class="image-link">
<span
style="margin: 0 0 20px 0; display: inline-block; vertical-align: middle; width: 100%;"
>
<a
target="_blank"
href="https://pikwizard.com/photo/data-analytics-dashboard-with-neon-highlights/11d01514a98878d5a1ce83eadb24c5fe/"
style="text-decoration: none; font-size: 10px; margin: 0;"
>
<img src="https://pikwizard.com/pw/medium/11d01514a98878d5a1ce83eadb24c5fe.jpg" style="margin: 0; width: 100%;" alt="" />
<p style="font-size: 12px; margin: 0;">PikWizard</p>
</a>
</span>
</span>
Free (free of charge)
Free for personal and commercial use.
Author: Creative Art