
- Home >
- Stock Photos >
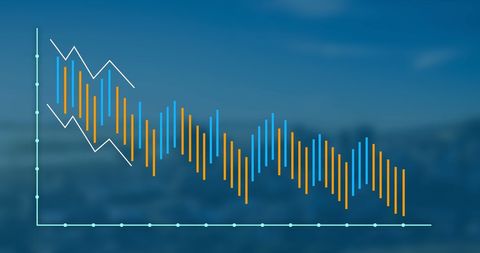
- Data Analytics Graphs on Blue Digital Background
Data Analytics Graphs on Blue Digital Background Image

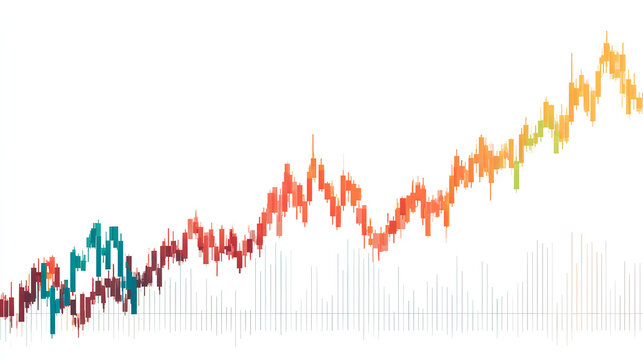
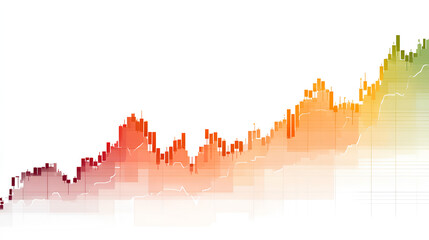
Graphs displayed on blue background convey data insights powerfully, featuring bar and line charts. Useful for presentations about financial analysis, economic trends, or business insights. Suitable for educational materials teaching statistics or data interpretation.
Powered by 


downloads
Tags:
More
Credit Photo
If you would like to credit the Photo, here are some ways you can do so
Text Link
photo Link
<span class="text-link">
<span>
<a target="_blank" href=https://pikwizard.com/photo/data-analytics-graphs-on-blue-digital-background/c15df518345f746b237a2a14523cb6c5/>PikWizard</a>
</span>
</span>
<span class="image-link">
<span
style="margin: 0 0 20px 0; display: inline-block; vertical-align: middle; width: 100%;"
>
<a
target="_blank"
href="https://pikwizard.com/photo/data-analytics-graphs-on-blue-digital-background/c15df518345f746b237a2a14523cb6c5/"
style="text-decoration: none; font-size: 10px; margin: 0;"
>
<img src="https://pikwizard.com/pw/medium/c15df518345f746b237a2a14523cb6c5.jpg" style="margin: 0; width: 100%;" alt="" />
<p style="font-size: 12px; margin: 0;">PikWizard</p>
</a>
</span>
</span>
Free (free of charge)
Free for personal and commercial use.
Author: Creative Art
Similar Free Stock Images

Premium


Premium


Premium


Premium


Premium

AI


Premium


Premium


Premium

Premium


Premium

AI


Premium


Premium


Premium


Premium


Premium


Premium


Premium


Premium


Premium

Premium


Premium


Premium


AI


Premium


Premium


Premium


Explore More Free Stock Images