- Home >
- Stock Photos >
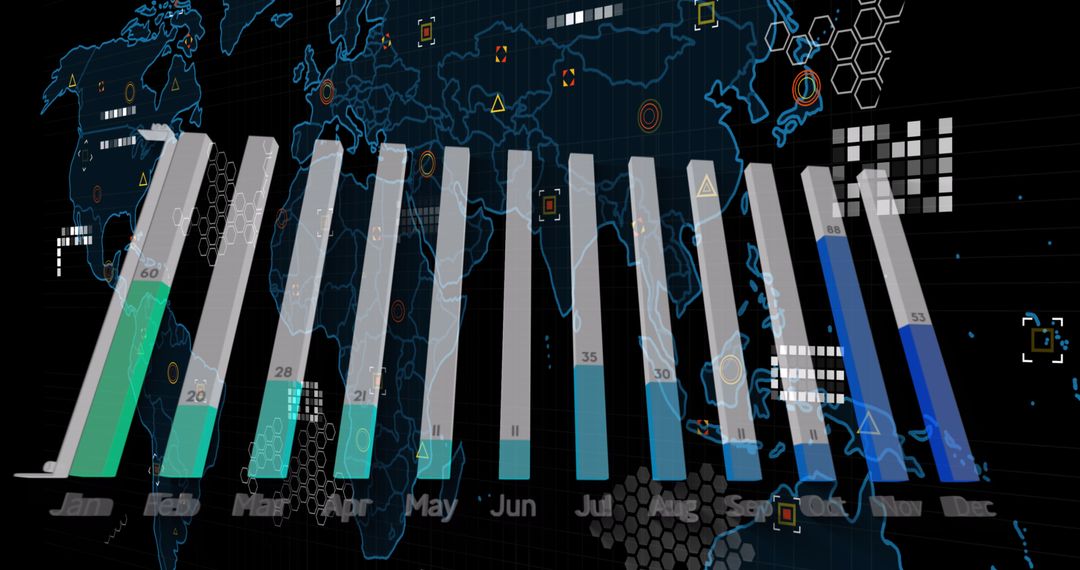
- Data Analytics Graphs Overlaid on Global Map for Financial Insights
Data Analytics Graphs Overlaid on Global Map for Financial Insights Image

Dynamic illustration showcasing data analytics graphs laid over a silhouetted world map, symbolizing global financial insights and trends. Dark backdrop reinforces the focus on digital interface and technical analysis. Useful for presentations, articles, or digital content about global economics, data science, or financial growth strategies.
Powered by 


2
downloads
downloads
Tags:
More
Credit Photo
If you would like to credit the Photo, here are some ways you can do so
Text Link
photo Link
<span class="text-link">
<span>
<a target="_blank" href=https://pikwizard.com/photo/data-analytics-graphs-overlaid-on-global-map-for-financial-insights/13872bc06f48f563a197bb9353a761cf/>PikWizard</a>
</span>
</span>
<span class="image-link">
<span
style="margin: 0 0 20px 0; display: inline-block; vertical-align: middle; width: 100%;"
>
<a
target="_blank"
href="https://pikwizard.com/photo/data-analytics-graphs-overlaid-on-global-map-for-financial-insights/13872bc06f48f563a197bb9353a761cf/"
style="text-decoration: none; font-size: 10px; margin: 0;"
>
<img src="https://pikwizard.com/pw/medium/13872bc06f48f563a197bb9353a761cf.jpg" style="margin: 0; width: 100%;" alt="" />
<p style="font-size: 12px; margin: 0;">PikWizard</p>
</a>
</span>
</span>
Free (free of charge)
Free for personal and commercial use.
Author: Authentic Images
Similar Free Stock Images

Premium


Premium


Premium


Premium


Premium


Premium


Premium


Premium


Premium


Premium


Premium


Premium


Premium


Premium


Premium


Premium


Premium


Premium


Premium


Premium


Premium


Premium


Premium


Premium