- Home >
- Stock Photos >
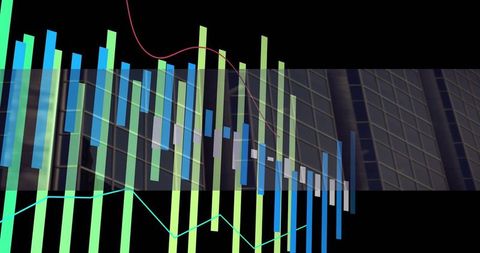
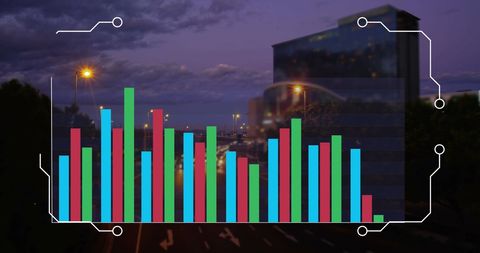
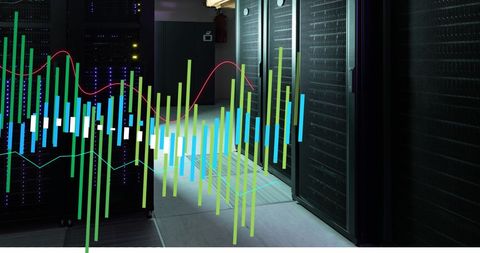
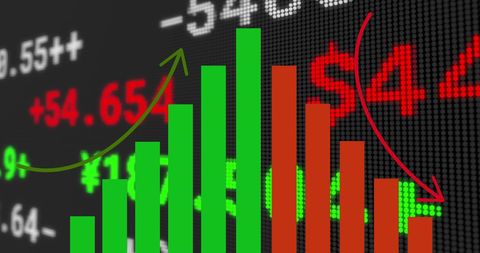
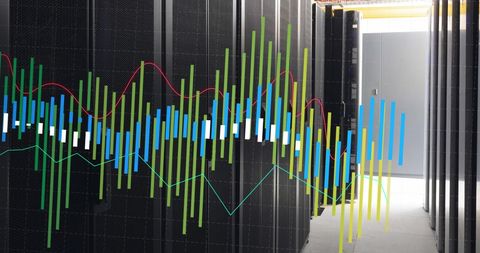
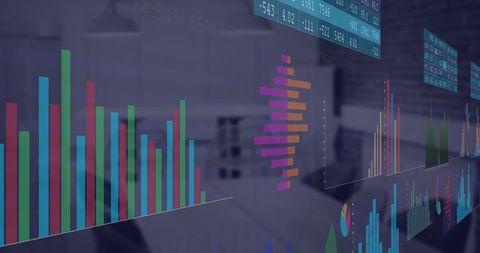
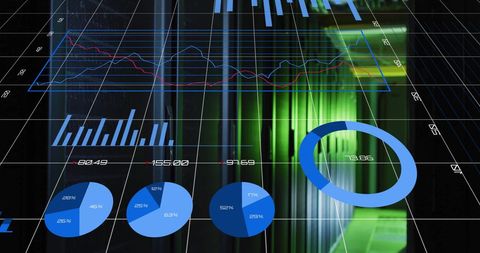
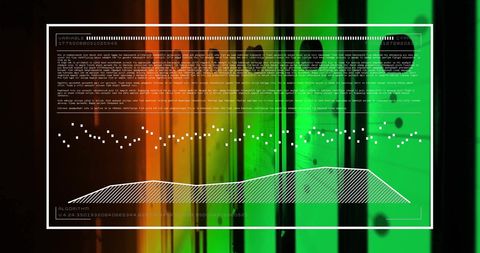
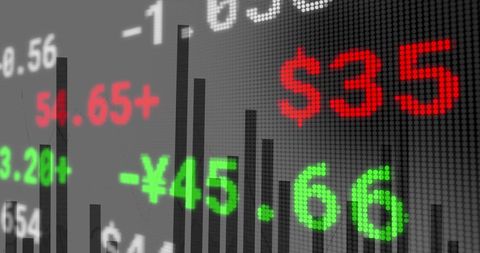
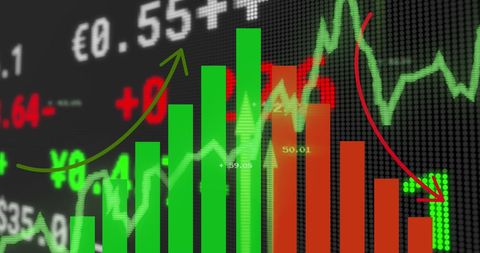
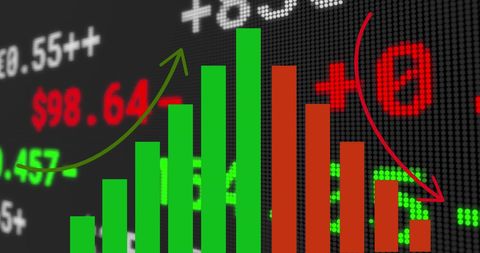
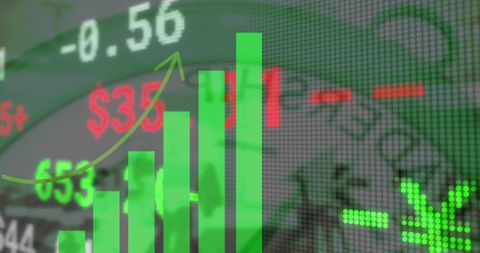
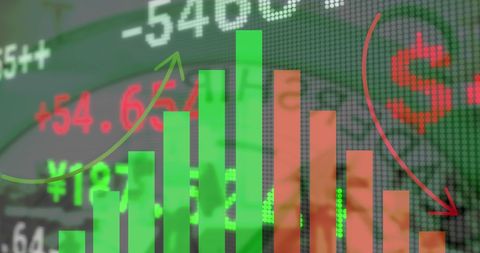
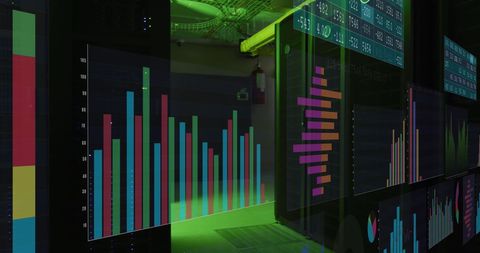
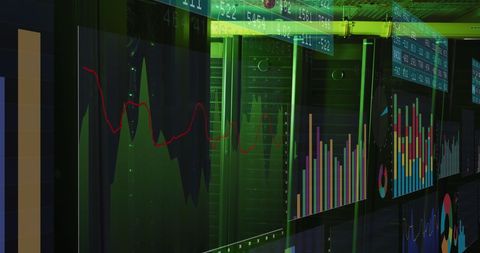
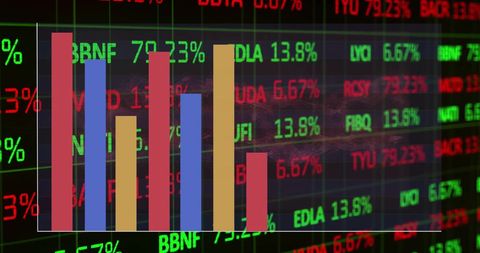
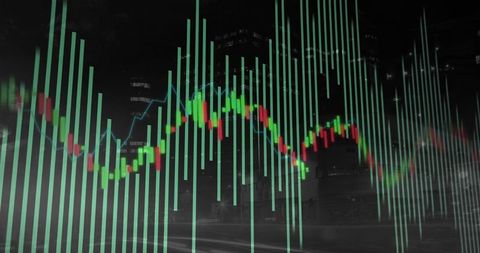
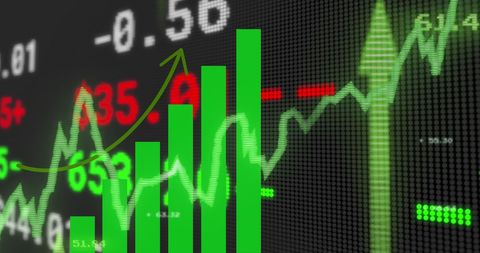
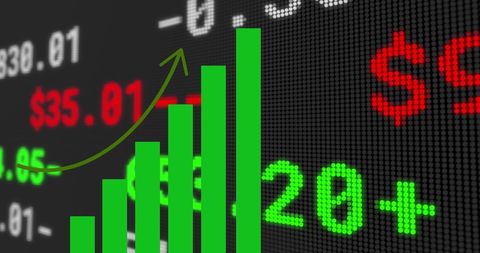
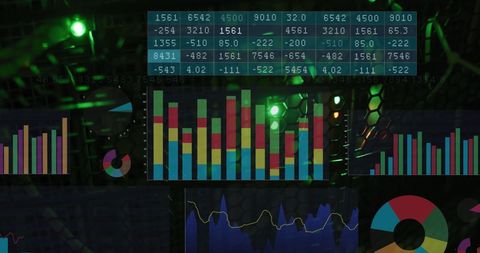
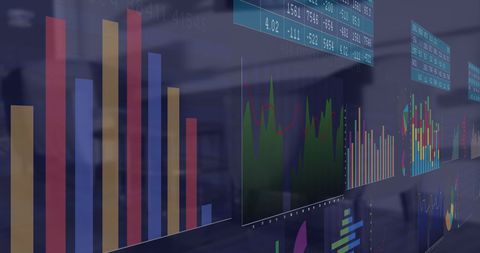
- Data Analytics in Action: Financial Growth and Trends
Data Analytics in Action: Financial Growth and Trends Image
Image displaying a digital rendering of a colorful financial graph with vibrant green and red bars. The images of fluctuating statistics suggest a focus on business growth, economic trends, or stock market data. Perfect for illustrating articles about financial analytics, technology advances in finance, or the role of data processing in investment strategies.
Powered by 


downloads
Tags:
More
Credit Photo
If you would like to credit the Photo, here are some ways you can do so
Text Link
photo Link
<span class="text-link">
<span>
<a target="_blank" href=https://pikwizard.com/photo/data-analytics-in-action-financial-growth-and-trends/ea925c042114ea2a081c82b070b3e0fb/>PikWizard</a>
</span>
</span>
<span class="image-link">
<span
style="margin: 0 0 20px 0; display: inline-block; vertical-align: middle; width: 100%;"
>
<a
target="_blank"
href="https://pikwizard.com/photo/data-analytics-in-action-financial-growth-and-trends/ea925c042114ea2a081c82b070b3e0fb/"
style="text-decoration: none; font-size: 10px; margin: 0;"
>
<img src="https://pikwizard.com/pw/medium/ea925c042114ea2a081c82b070b3e0fb.jpg" style="margin: 0; width: 100%;" alt="" />
<p style="font-size: 12px; margin: 0;">PikWizard</p>
</a>
</span>
</span>
Free (free of charge)
Free for personal and commercial use.
Author: Awesome Content
Similar Free Stock Images
Loading...
Premium


Premium

Premium

Premium


Premium


Premium


Premium


Premium


Premium


Premium


Premium


Premium


Premium


Premium


Premium


Premium


Premium


Premium


Premium

Premium

Premium


Premium


Premium


Premium


Premium