- Home >
- Stock Photos >
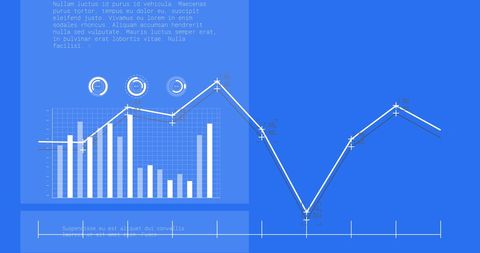
- Data Analytics Interface with Charts on Blue Background
Data Analytics Interface with Charts on Blue Background Image

Abstract visuals illustrate concepts of data analytics and statistical processing. Suitable for technology, business presentations, infographics, and articles about computing or digital trends.

downloads
Tags:
More
Credit Photo
If you would like to credit the Photo, here are some ways you can do so
Text Link
photo Link
<span class="text-link">
<span>
<a target="_blank" href=https://pikwizard.com/photo/data-analytics-interface-with-charts-on-blue-background/28928ad14968f473771d214826468a3f/>PikWizard</a>
</span>
</span>
<span class="image-link">
<span
style="margin: 0 0 20px 0; display: inline-block; vertical-align: middle; width: 100%;"
>
<a
target="_blank"
href="https://pikwizard.com/photo/data-analytics-interface-with-charts-on-blue-background/28928ad14968f473771d214826468a3f/"
style="text-decoration: none; font-size: 10px; margin: 0;"
>
<img src="https://pikwizard.com/pw/medium/28928ad14968f473771d214826468a3f.jpg" style="margin: 0; width: 100%;" alt="" />
<p style="font-size: 12px; margin: 0;">PikWizard</p>
</a>
</span>
</span>
Free (free of charge)
Free for personal and commercial use.
Author: Authentic Images