1. Home > 
  2. Stock Photos > 
  3. Data Analytics Interface with Digital Technology Timeline

Data Analytics Interface with Digital Technology Timeline Image

Data Analytics Interface with Digital Technology Timeline

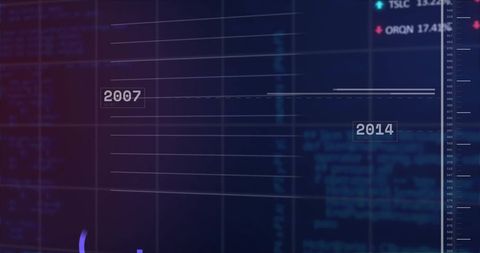
Background with digital data projections and timeline highlights captivating visualization of technological progression. Useful for clients seeking futuristic tech interfaces, digital solutions promotions, financial analytics companies, and IT presentations focused on data-driven insights.

Powered by Shutterstock logo - Get 15% off with code: PIKWIZARD15
Online trading, Investment, Strategy market plan, and Stock mark - Powered by Shutterstock - Get 15% off with code: PIKWIZARD15A hand interacts with futuristic virtual data screens displaying analytics and charts on a dark background. - Powered by Shutterstock - Get 15% off with code: PIKWIZARD15Intelligence (BI) and business analytics (BA) with key performance indicators (KPI) dashboard concept.StartUp Programming Team. Website designer working digital tablet dock keyboard. - Powered by Shutterstock - Get 15% off with code: PIKWIZARD15Data Science and engineering, digital technology, tech background. Software engineer working with database and big data analytics, cloud computing with AI and data exchange, innovation technology - Powered by Shutterstock - Get 15% off with code: PIKWIZARD15Man look at the dashboard with graphs and charts. Concept of data management system, business intelligence, data statistics, marketing analysis, key performance indicators (KPI) and analytics. - Powered by Shutterstock - Get 15% off with code: PIKWIZARD15

Credit Photo

If you would like to credit the Photo, here are some ways you can do so

Free (free of charge)

Free for personal and commercial use.

Author: Authentic Images

Similar Free Stock Images

Dynamic Financial Data Display with Stock Market Tickers
Premium
Analytics Finance and Business concept. Big data analytics and business intelligence BI.
Digital Financial Data Stream with Numeric Overlay
Futuristic Data Visualization Interface with Global Network Map
Financial Data Over Grid Indicating Market Trends and Analytics
Ukraine Crisis Financial Graphs Overlay
Premium
Businessman using futuristic user interface with virtual data analytics. Innovative dashboard with financial charts, graphs, and global network information for business intelligence.
Financial Data Analytics on Digital Interface Displaying Graphs
Digital Ruble Symbol with Data Graph Overlay
Digital Code and Graphs on Gradient Background
Financial Data Display in Digital Grid Design
Premium
Businesspeople using laptop with abstract digital charts at workplace. Teamwork concept
Financial Data Analysis Graph with Growing Trends
Digital Financial Data Interface with Graphs and Trends
Stock Market Data Visuals Displaying Financial Analysis Trends
Digital Interface with Data Charts and Graphs Overlaying Electric Pylons
Premium
Elevate healthcare with AI technology services.Virtual health care analytics empower medical professionals in the medical revolution. Data analytics enhance patient care and healthcare administration.
Digital Interface with Data Analytics and Processing Visuals
Abstract Financial Data Analysis with Charts and Figures
Dynamic Stock Market Analysis on Digital Screen
Dynamic Stock Market Graph with Percentage Indicators
Premium
Business man using computer hand close up futuristic cyber space decentralized finance coding background, business data analytics programming online VPN network metaverse digital world technology
Colorful Bar Graph with Digital Financial Data Analysis Display
Financial Data Analytics Over Digital Grid Screen
Abstract Financial Chart with Rising and Falling Indicators
Digital Financial Analysis Interface Over Data Grid
Premium
AI (Artificial intelligence) growing concept. Businessman hand typing keyboard laptop (notebook) with hologram technology. Business technology link digital marketing. Big data and Financial banking.
Dynamic Financial Graph Displaying Market Trends
Financial Data Charts with Viewing Grid in Dark Perspective
Dynamic Financial Graph with Data Analysis Conceptual Background
Digital Dashboard with Line Charts and Data Analytics Visualization
Dynamic Stock Market Ticker Display with Financial Graphs
Colorful Stock Market Display with Graphs and Tickers on Blue Background
Premium
Big data analytics and business intelligence (BI) concept with chart and graph icons on a digital screen interface and a businessman in background
Global Finance and Data Visualization Interface Background
Digital Financial Data Over Dynamic Grid Background
Financial Data with Ukraine Flag Illustrates Economic Impact
Digital Data Processing and Encryption Interface Concept
Premium
Speed lines trail from night city- lens effect. technology background
Dynamic Financial Charts with Blue Digital Interface
Digital Data Processing on Dynamic Green Background
Financial Data Processing Visualization Over World Map
Futuristic Financial Data Analysis with Global Market Insights
Premium
Data analysis, Business intelligence (BI), business analytics (BA) with key performance indicators (KPI) dashboard concept. Businessman working on digital tablet, financial graph, market research
Digital Data Analysis Interface with Graphs
Statistical Data and Trends Over Digital Grid Overlay
Graphical Display of Stock Market Trends with Gradient Background
Digital Financial Graph Illustrating Stock Market Trends
Premium
Person interacting with digital ESG interface showing sustainability data and AI technology, in modern graphic style on dark background, concept of innovation
Abstract Digital Stock Market Interface with Graphs and Data
Digital Financial Data Analysis and Stock Market Charting
Financial Data Analysis and Global Market Trends
Digital Data Processing and Stock Market Visualization
Premium
Big Data Technology for Business Finance Analytic Concept. Modern graphic interface shows massive information of business sale report, profit chart and stock market trends analysis on screen monitor.
Digital Financial Data Analysis on Futuristic Blue Interface
Futuristic Financial Data Analysis Interface Concept
Cybersecurity Threat Alert with Malware Concept on Digital Grid
Digital Financial Data Display with Analytical Charts
Premium
EV electric vehicle technology industry concept, futuristic virtual graphic touch user interface on screen with auto repair garage blurred on background.
Digital Financial Data Processing Interface with Graphs and Codes
Financial Data Processing on Digital Graph Displayed on Screen
Cybersecurity Visualization with HTML Code and Analytics Chart
Digital Stock Market Data Visualization with Rising and Falling Prices
Dynamic Stock Market Indicators and Graphs on Blue Background
Digital Financial Data and Dynamic Stock Market Graphs
Premium
Hand holding smartphone displays data visualizations, including histogram and pie chart. Analytics, digital transformation and increasing use of mobile technology in business. Minimalist art collage.
Advanced Financial Data Visualization on Digital Interface
Abstract Digital Interface with Data Processing Code
Digital Data Processing Graph Interface with Progress Bar
Abstract Financial Data Chart with Light Trails
Premium
Man look at the dashboard with graphs and charts. Concept of data management system, business intelligence, data statistics, marketing analysis, key performance indicators (KPI) and analytics.
Digital Code Flow on Grid Background
Digital Interface of Data Processing Over Cityscape
Digital Financial Data Analysis with Stock Market Insights
Digital Financial Data Display Tracking Market Trends
Premium
Desktop Computer Monitor with Finance Statistical Data Software and Progressive User Interface Standing on the Desk in the Modern Business Office. In the Background Glass Wall with Big City Office.
Stock Market Trends and Data Analysis over Digital Grid
Holographic Stock Market Analysis with Charts and Data
Dynamic Financial Charts and Data in Futuristic Interface
Data Analytics with Dynamic Global Market Trends on Screen
Premium
Displaying financial chart in dark blue grid, turquoise and orange bars, white-red trend lines. Finance, data analytics, digital interface, technology, charts, investment, financial growth
Futuristic Financial Data Interface with Graphs and Binary Code
Dynamic Financial Data and Graph Analysis on Digital Display
Data Processing Overlaid on Graphs and Code in Digital Interface
Digital Display of Financial Data with Graph and Figures
Premium
business, people, cyberspace and future technology concept - close up of businessman in suit working with virtual charts over dark background
Analyzing Financial Data with Global Trends and Charts
Digital Data Analysis with Financial Charts and Graphs
Dynamic Financial Data Growth Chart Display
Futuristic Stock Market Graphs on Digital Display
Premium
Concept of AI-powered healthcare technology. Doctor uses smart digital interface to manage patient data, visualize diagnostics, and operate remote medical systems with futuristic tools.
Financial Graph and Data on Digital Interface
Displaying Cybersecurity Dashboard with Global Map, Donut Chart, Candlestick and Tabular Data
Financial Data and Graphs on Digital Screen
Dynamic Financial Data and Stock Market Interface
Abstract Stock Market Chart with Financial Data
Analyzing Global Financial Markets with Data Visualization
Premium
Business man computer hand close up futuristic cyber space finance AI chatbot artificial coding coding background business data analytics programming online network metaverse digital world technology
Digital Interface with Data Processing and Global Connectivity Theme
Financial Data Processing with Digital Interface
Digital Financial Data Display with Graphs and Analytics
Digital Financial Data Analysis with Graphs and Charts
Premium
Doctor using tablet surrounded by futuristic medical icons, symbolizing digital healthcare innovation. Great for medical tech, telemedicine, and healthcare analytics.
Dynamic Data Overlays on Urban Cityscape Conveying Financial Markets Progress
Digital Financial Data Analytics with Graphs and Codes
Innovative Data Visualization with Digital Interface
Digital Financial Data Graph with Winter Snowflake Theme
Premium
Displaying overlay on dark blur, showing bar line and pie placeholders with % labels. Technology, data, analytics, interface, innovation, futurism, dashboard
Digital Financial Data Display with Growing Graph
Futuristic Data Recovery Concept on Digital Interface
Digital Finance Analytics in Modern Business Environment
Holographic Financial Stock Market Analysis Visualization
Premium
Artificial intelligence AI research of robot and cyborg development for future of people living. Digital data mining and machine learning technology design for computer brain communication.
Digital Data Interface with Global Financial Statistics
Digital Financial Graphs and Business Analytics on Blue Backdrop
Financial Data Projection in Modern Office Space
Digital Data Processing with Technology Interface on Blue Background
Premium
Man interacting with a holographic molecule in blue color. Concept of biotechnology research , Innovative biotech, molecular biology, medical research and molecular nano structures
Animated Financial Graph with Candlestick Chart
Futuristic Digital Interface with Charts and Data Visualization
Financial Data Graphic with Rising Trends on Digital Grid
Abstract Digital Financial Data Graph Chart
Premium
Displaying white vertical waveform bars pulsing on screen over American flag with code snippets. Technology, data, analytics, digital, interface, visualization, innovation
Layered Cybersecurity Displaying Terminal Access, Analytics, Pie and Candlestick Charts