- Home >
- Stock Photos >
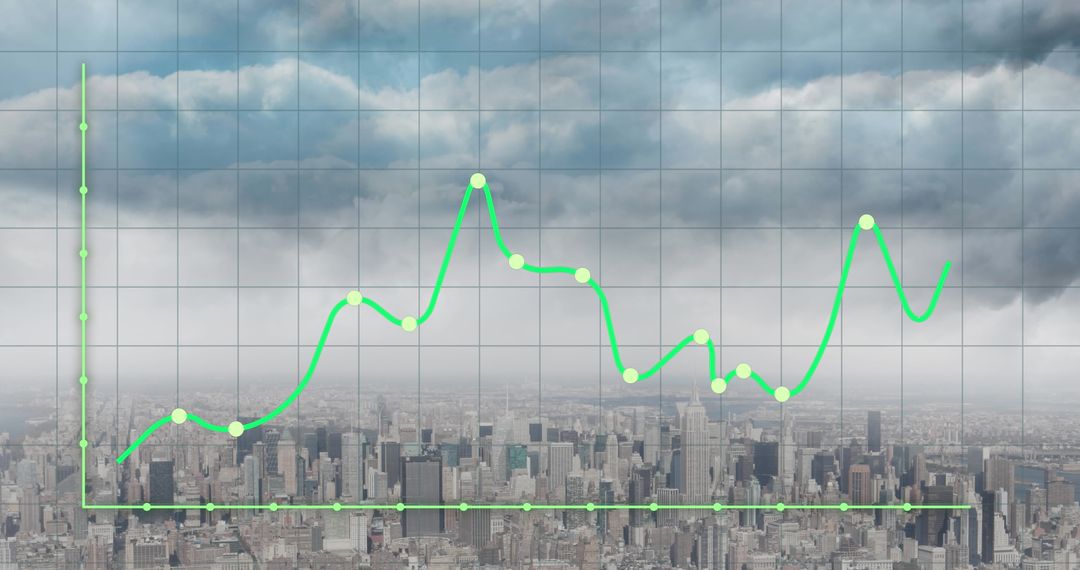
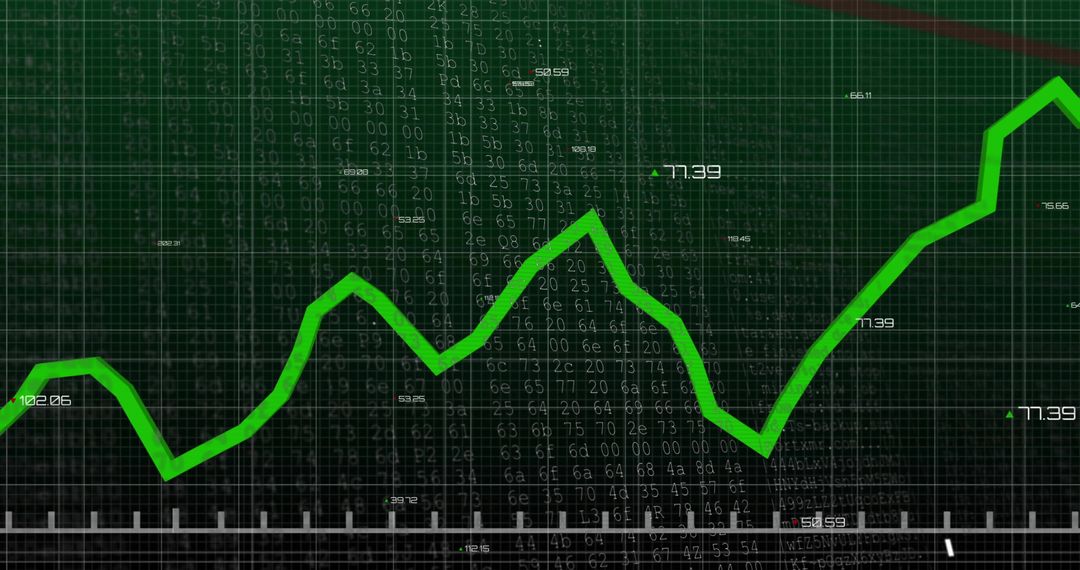
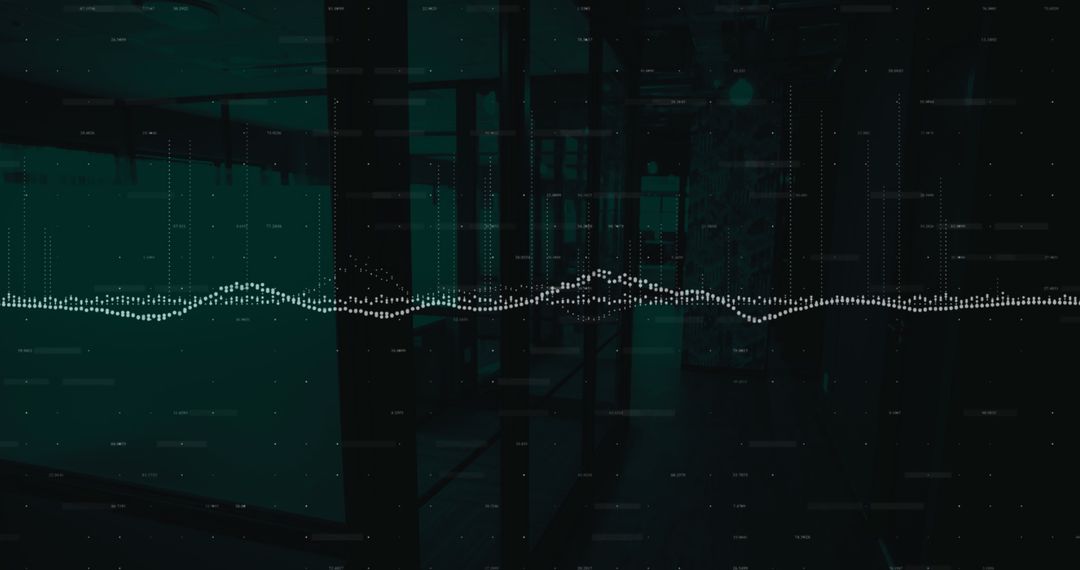
- Data Analytics of Global Markets Above City Skyline
Data Analytics of Global Markets Above City Skyline Image

Green line graph symbolizing market trends over blurred cityscape adding futuristic and corporate theme. Perfect for business presentations, financial market analyses, futuristic design projects, technology blogs, and investment company websites.
Powered by  - Get 15% off with code: PIKWIZARD15


2
downloads
downloads
Tags:
More
Credit Photo
If you would like to credit the Photo, here are some ways you can do so
Text Link
photo Link
<span class="text-link">
<span>
<a target="_blank" href=https://pikwizard.com/photo/data-analytics-of-global-markets-above-city-skyline/1d033ea72d1c0acfd7e98eea7a4df34f/>PikWizard</a>
</span>
</span>
<span class="image-link">
<span
style="margin: 0 0 20px 0; display: inline-block; vertical-align: middle; width: 100%;"
>
<a
target="_blank"
href="https://pikwizard.com/photo/data-analytics-of-global-markets-above-city-skyline/1d033ea72d1c0acfd7e98eea7a4df34f/"
style="text-decoration: none; font-size: 10px; margin: 0;"
>
<img src="https://pikwizard.com/pw/medium/1d033ea72d1c0acfd7e98eea7a4df34f.jpg" style="margin: 0; width: 100%;" alt="" />
<p style="font-size: 12px; margin: 0;">PikWizard</p>
</a>
</span>
</span>
Free (free of charge)
Free for personal and commercial use.
Author: Authentic Images
Similar Free Stock Images

Premium


Premium


Premium


Premium


Premium


Premium


Premium


Premium


Premium


Premium


Premium


Premium


Premium


Premium


Premium


Premium


Premium


Premium


Premium


Premium


Premium


Premium


Premium


Premium