- Home >
- Stock Photos >
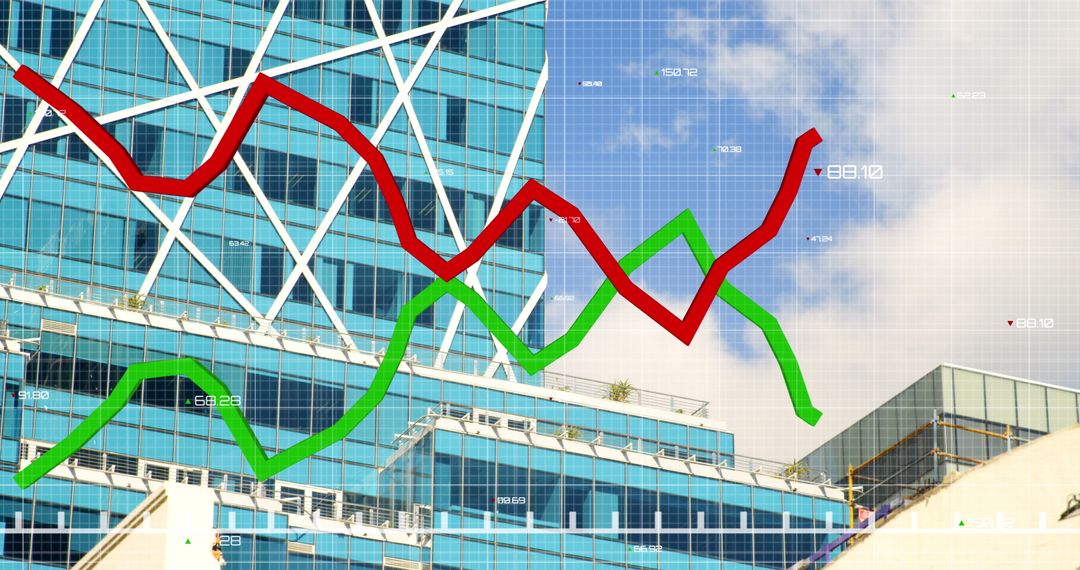
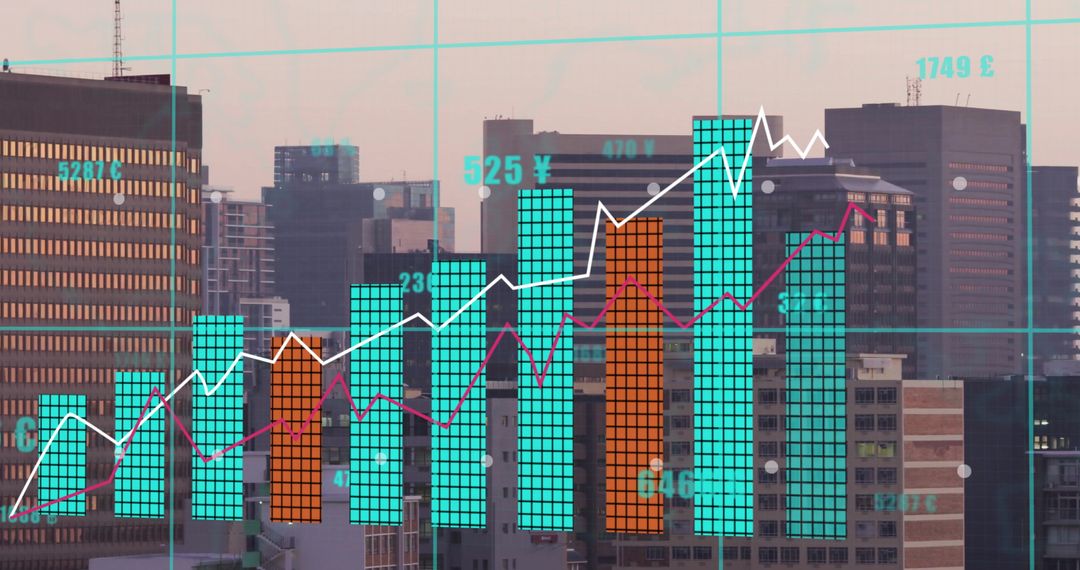
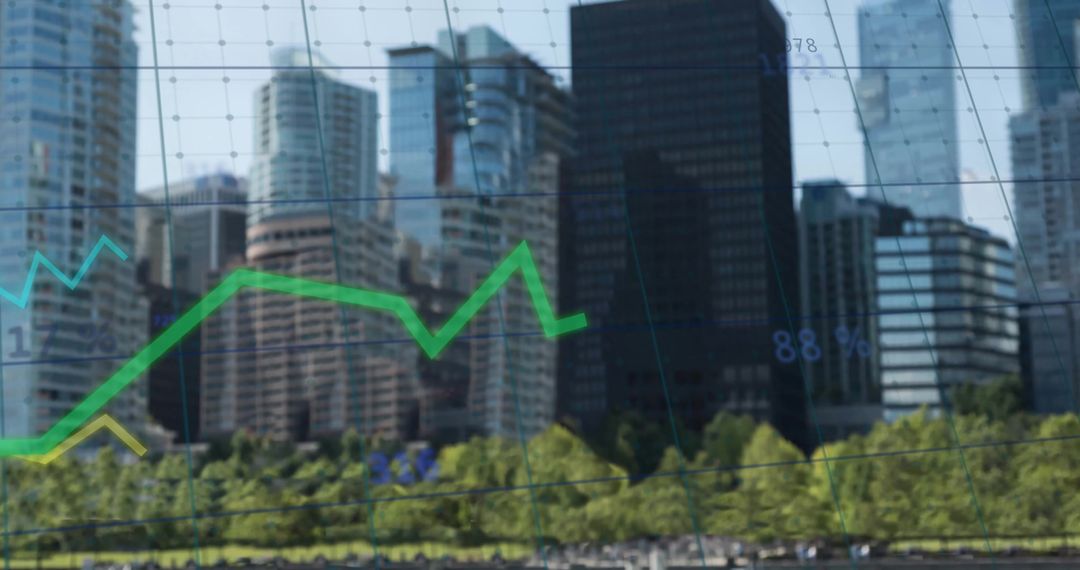
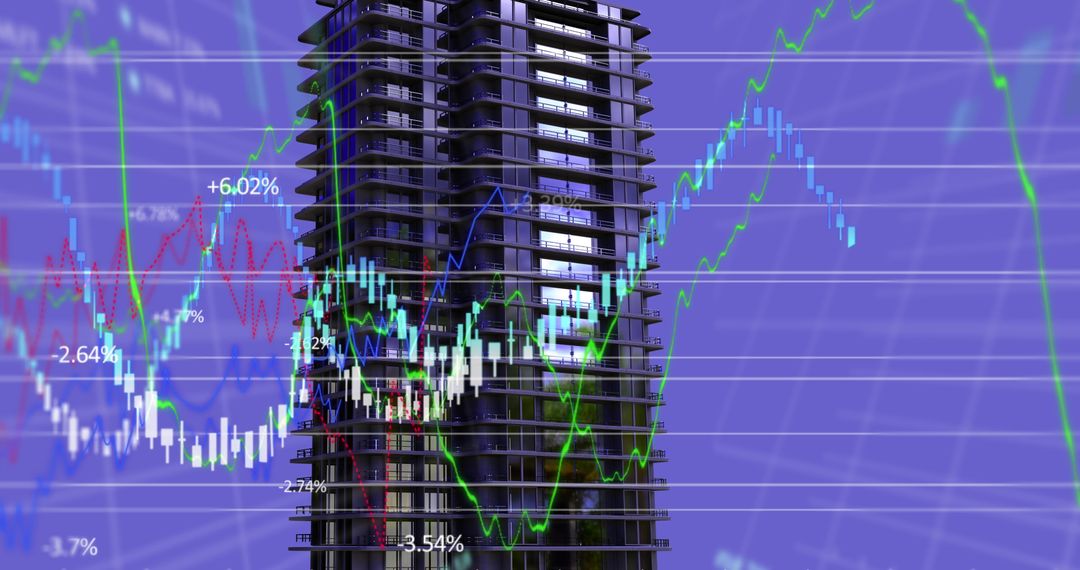
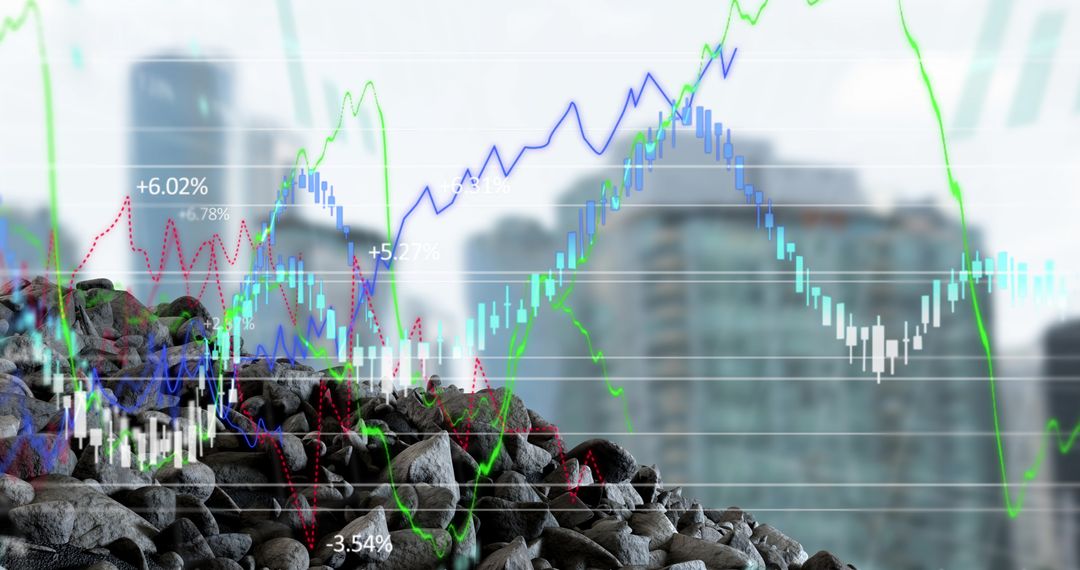
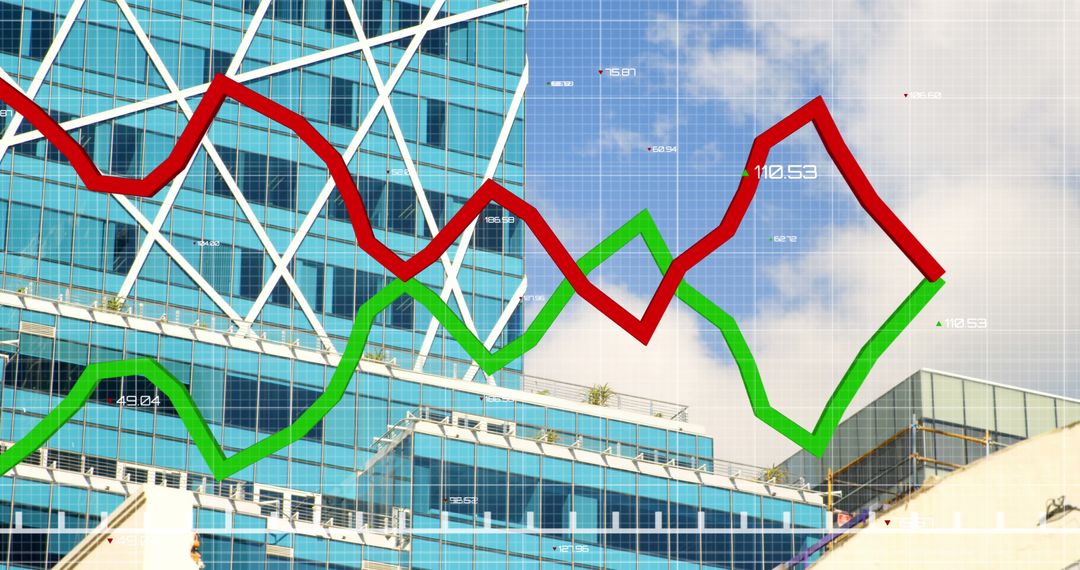
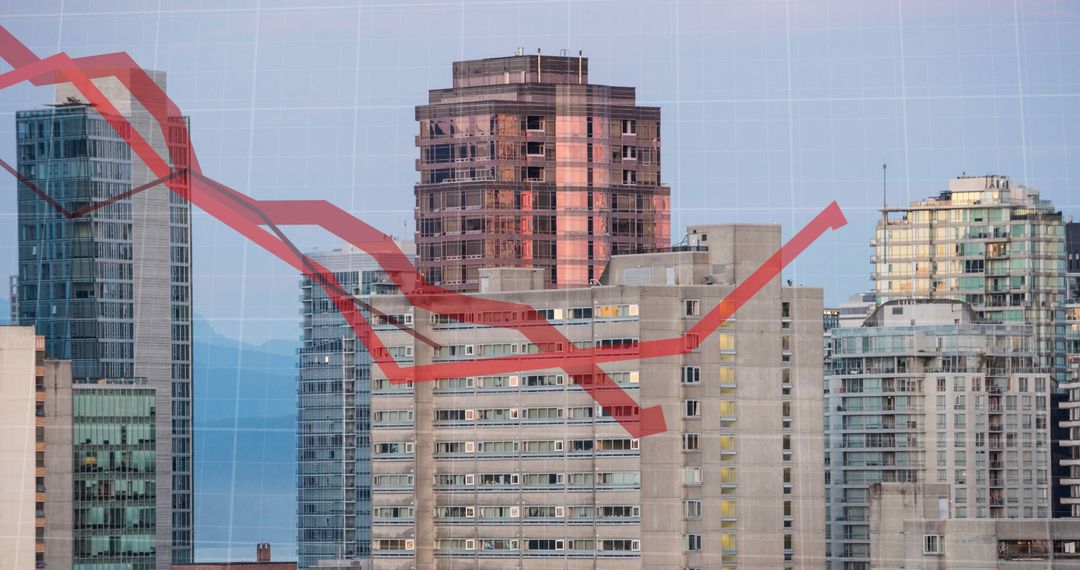
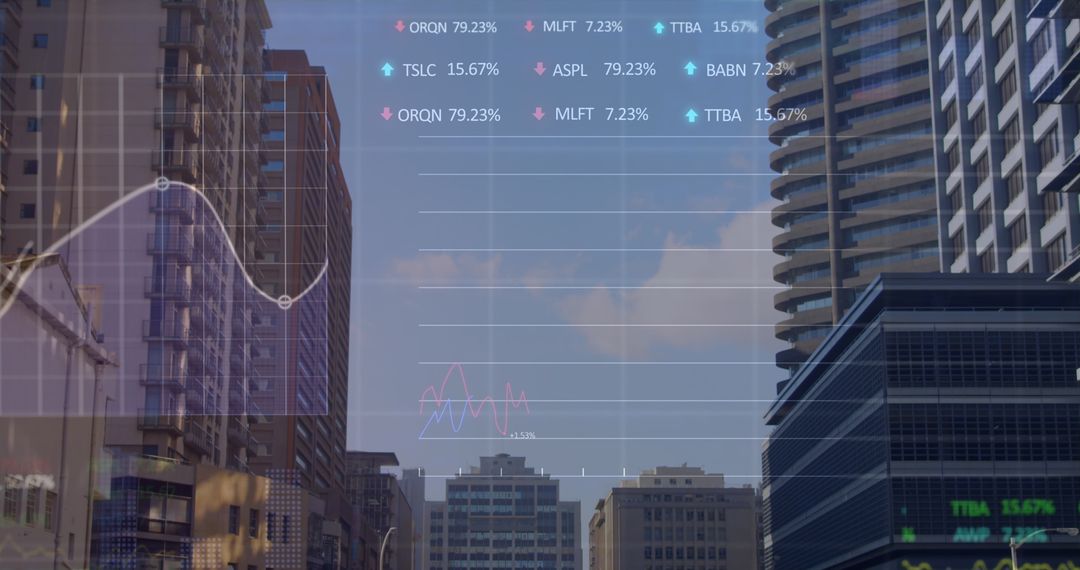
- Data Analytics on Skyscrapers with Descending Graph
Data Analytics on Skyscrapers with Descending Graph Image
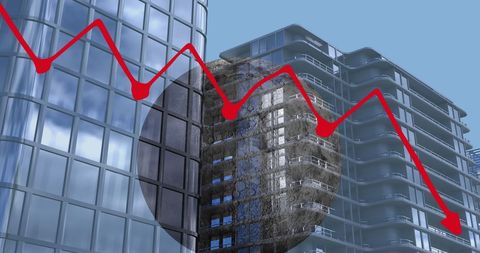
Visual representation illustrating business and data analytics against tall skyscrapers. The descending graph symbolizes potential for financial market trends analysis or economic downturns, while architectural elements depict the corporate domain. Perfect for business presentations, finance-related content, or articles on market analysis.
Powered by  - Get 15% off with code: PIKWIZARD15


2
downloads
downloads
Tags:
More
Credit Photo
If you would like to credit the Photo, here are some ways you can do so
Text Link
photo Link
<span class="text-link">
<span>
<a target="_blank" href=https://pikwizard.com/photo/data-analytics-on-skyscrapers-with-descending-graph/447cd5f889d5d250fb333ba4621e8c96/>PikWizard</a>
</span>
</span>
<span class="image-link">
<span
style="margin: 0 0 20px 0; display: inline-block; vertical-align: middle; width: 100%;"
>
<a
target="_blank"
href="https://pikwizard.com/photo/data-analytics-on-skyscrapers-with-descending-graph/447cd5f889d5d250fb333ba4621e8c96/"
style="text-decoration: none; font-size: 10px; margin: 0;"
>
<img src="https://pikwizard.com/pw/medium/447cd5f889d5d250fb333ba4621e8c96.jpg" style="margin: 0; width: 100%;" alt="" />
<p style="font-size: 12px; margin: 0;">PikWizard</p>
</a>
</span>
</span>
Free (free of charge)
Free for personal and commercial use.
Author: Authentic Images
Similar Free Stock Images