
- Home >
- Stock Photos >
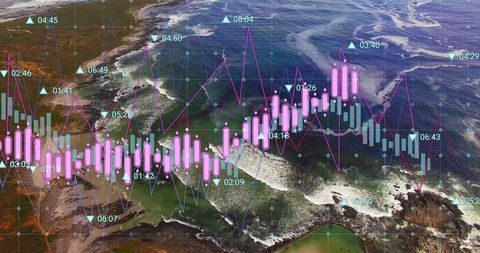
- Data Analytics on Stormy Skyline with Chart Graphics
Data Analytics on Stormy Skyline with Chart Graphics Image

Graphs and data charts overlaying a dramatic, cloudy sky create a powerful visual fusion of technology and nature. Ideal for illustrating concepts related to market volatility, data-driven decision making, and the dynamic nature of financial trading and analytics. Suitable for use in presentations, educational materials on finance technology, or digital economy applications.
Powered by 


downloads
Tags:
More
Credit Photo
If you would like to credit the Photo, here are some ways you can do so
Text Link
photo Link
<span class="text-link">
<span>
<a target="_blank" href=https://pikwizard.com/photo/data-analytics-on-stormy-skyline-with-chart-graphics/0e278d97022a3b60f16edd4394e3f45b/>PikWizard</a>
</span>
</span>
<span class="image-link">
<span
style="margin: 0 0 20px 0; display: inline-block; vertical-align: middle; width: 100%;"
>
<a
target="_blank"
href="https://pikwizard.com/photo/data-analytics-on-stormy-skyline-with-chart-graphics/0e278d97022a3b60f16edd4394e3f45b/"
style="text-decoration: none; font-size: 10px; margin: 0;"
>
<img src="https://pikwizard.com/pw/medium/0e278d97022a3b60f16edd4394e3f45b.jpg" style="margin: 0; width: 100%;" alt="" />
<p style="font-size: 12px; margin: 0;">PikWizard</p>
</a>
</span>
</span>
Free (free of charge)
Free for personal and commercial use.
Author: Authentic Images
Similar Free Stock Images

Premium


Premium

Premium


Premium


Premium


Premium


Premium


Premium


Premium

Premium

Premium


Premium


Premium


Premium


Premium


Premium


Premium


Premium


Premium

Premium


Premium


Premium


Premium


Premium


Premium

Explore More Free Stock Images