- Home >
- Stock Photos >
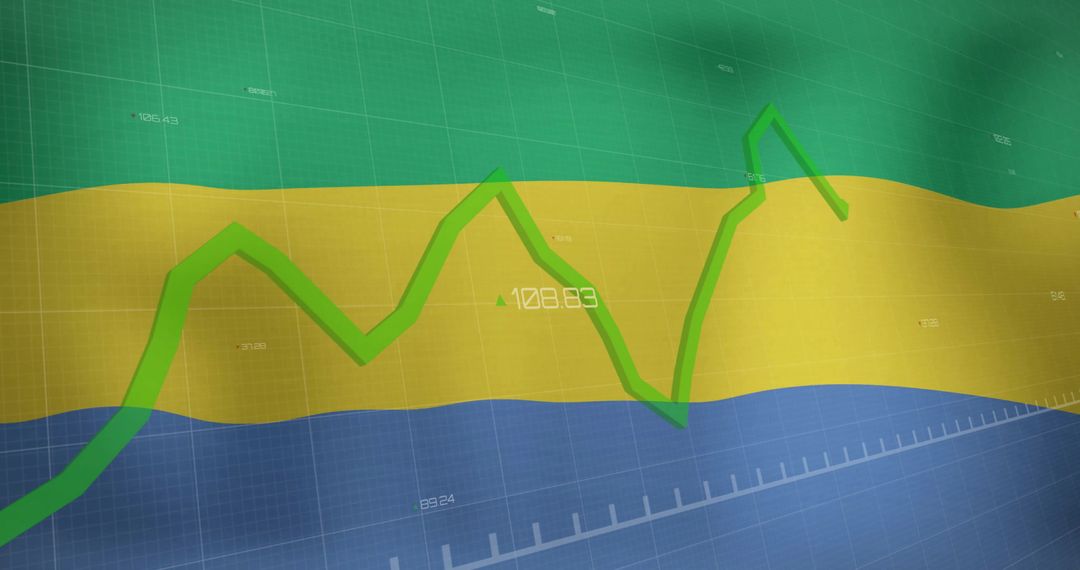
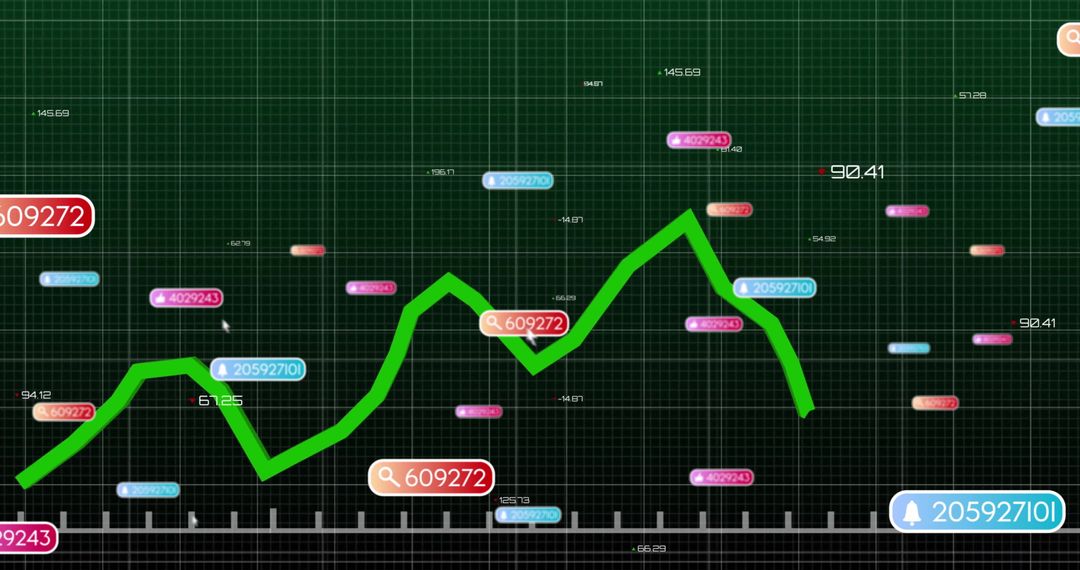
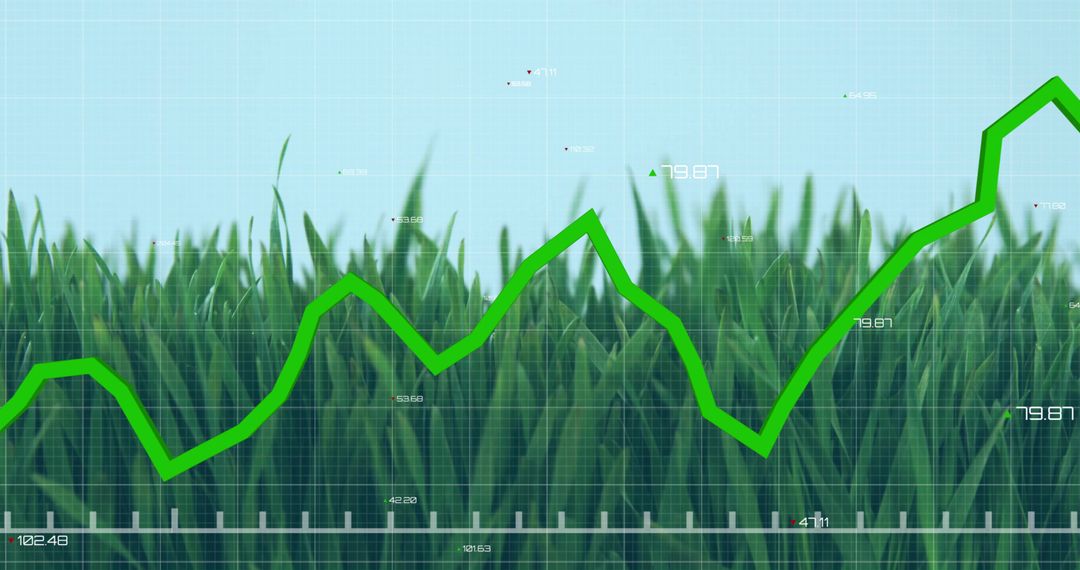
- Data Analytics Overlay Nature Scene with Dewy Grass Dawn
Data Analytics Overlay Nature Scene with Dewy Grass Dawn Image
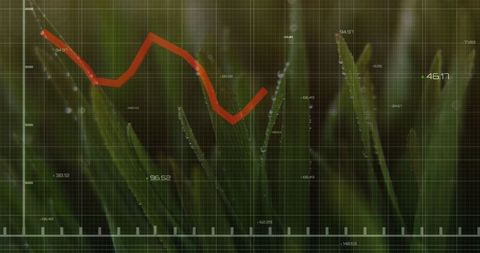
Combining natural imagery with data visualization, this depicts a graph over green grass covered in morning dew. It represents the intersection of ecology and data analysis, suitable for depicting research, environmental studies, statistics, and growth metrics. Ideal for websites, presentations, and articles about the environment, technology in nature, or analytics applied to ecology.
Powered by  - Get 15% off with code: PIKWIZARD15


0
downloads
downloads
Tags:
More
Credit Photo
If you would like to credit the Photo, here are some ways you can do so
Text Link
photo Link
<span class="text-link">
<span>
<a target="_blank" href=https://pikwizard.com/photo/data-analytics-overlay-nature-scene-with-dewy-grass-dawn/7d0cd17704df4360f4b45535a9dcfec1/>PikWizard</a>
</span>
</span>
<span class="image-link">
<span
style="margin: 0 0 20px 0; display: inline-block; vertical-align: middle; width: 100%;"
>
<a
target="_blank"
href="https://pikwizard.com/photo/data-analytics-overlay-nature-scene-with-dewy-grass-dawn/7d0cd17704df4360f4b45535a9dcfec1/"
style="text-decoration: none; font-size: 10px; margin: 0;"
>
<img src="https://pikwizard.com/pw/medium/7d0cd17704df4360f4b45535a9dcfec1.jpg" style="margin: 0; width: 100%;" alt="" />
<p style="font-size: 12px; margin: 0;">PikWizard</p>
</a>
</span>
</span>
Free (free of charge)
Free for personal and commercial use.
Author: Authentic Images
Similar Free Stock Images