- Home >
- Stock Photos >
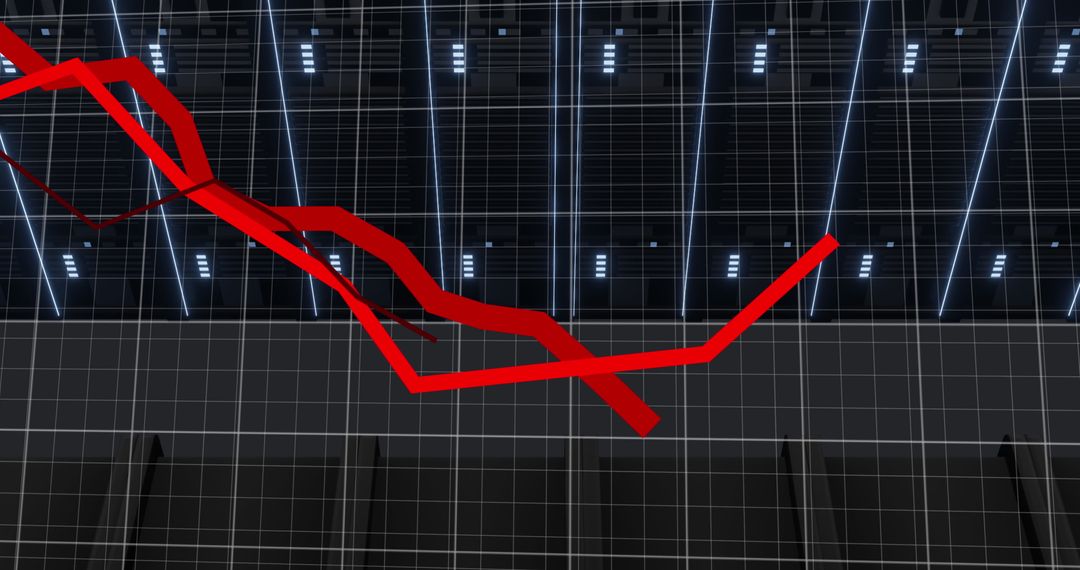
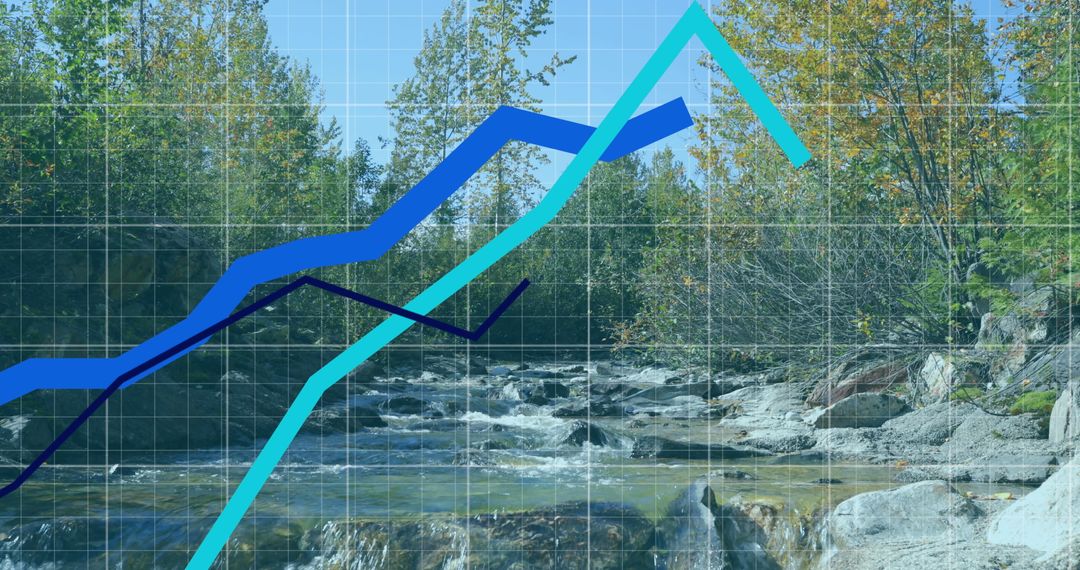
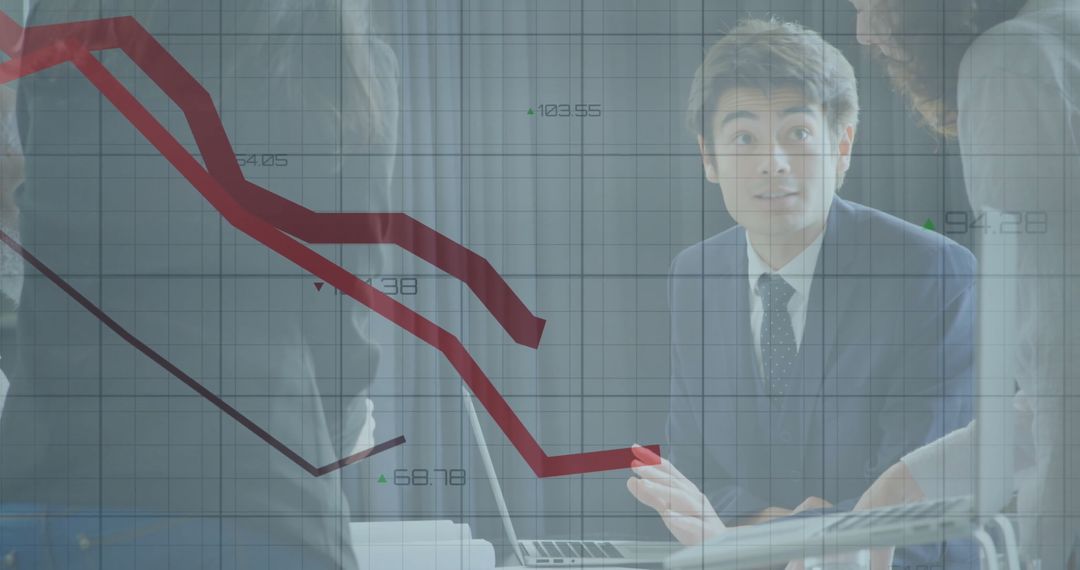
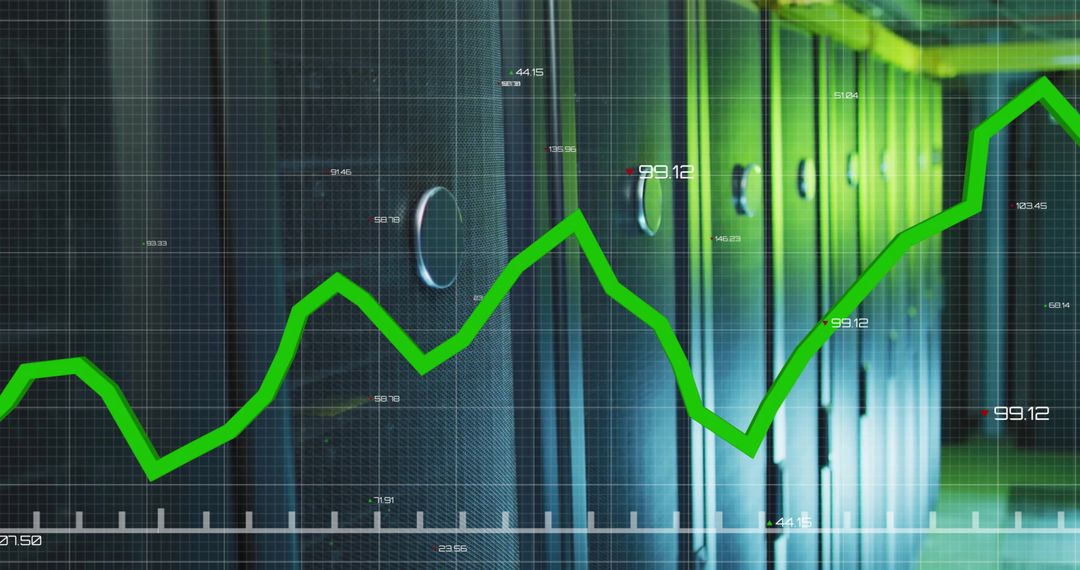
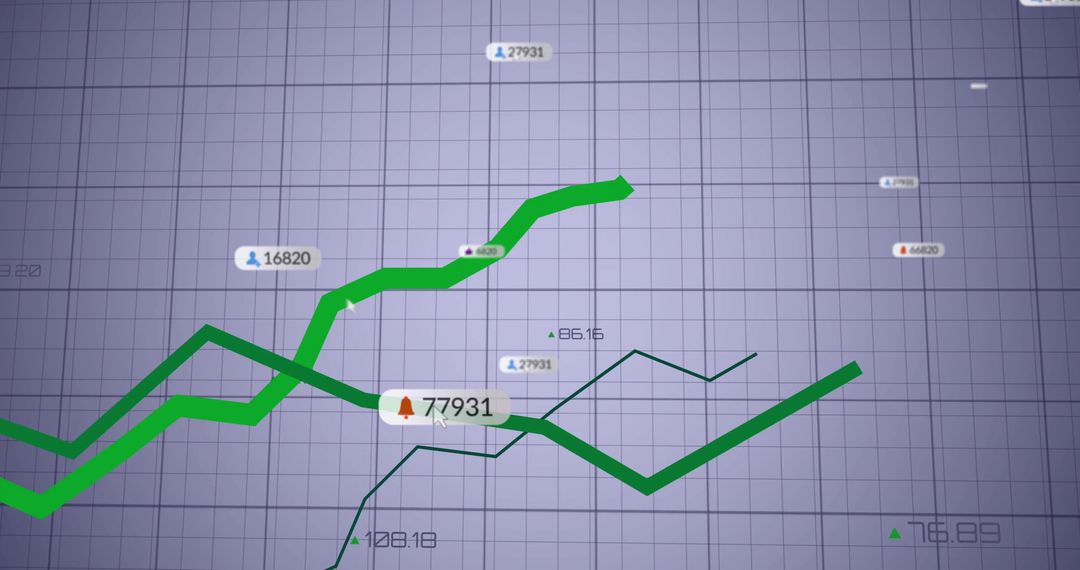
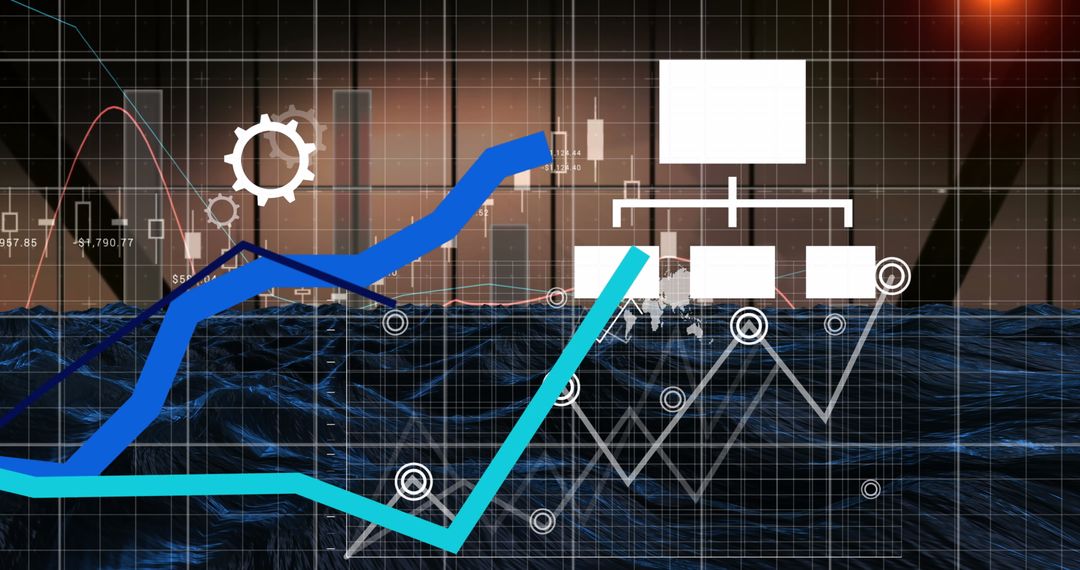
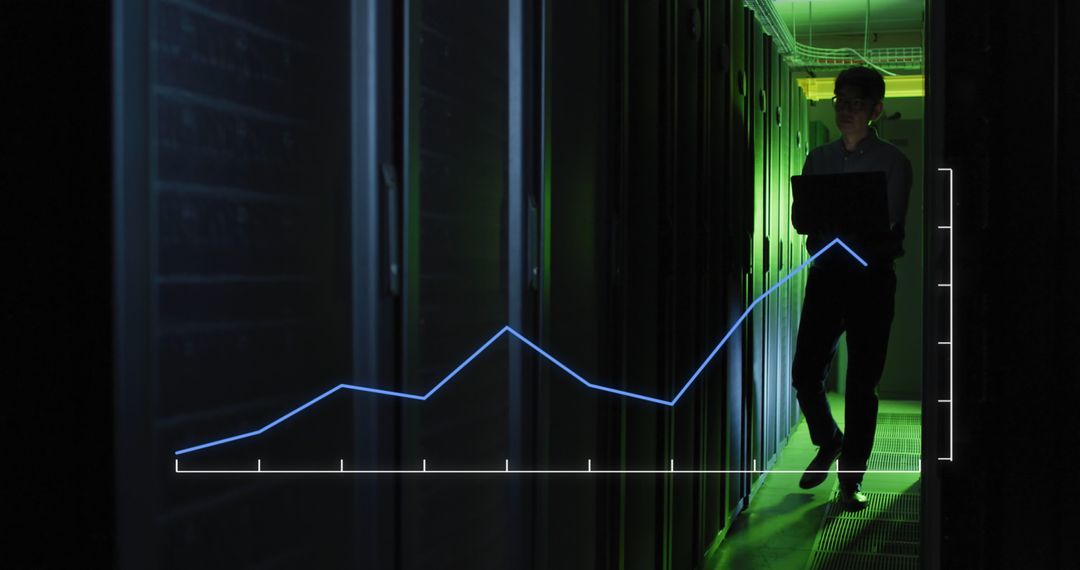
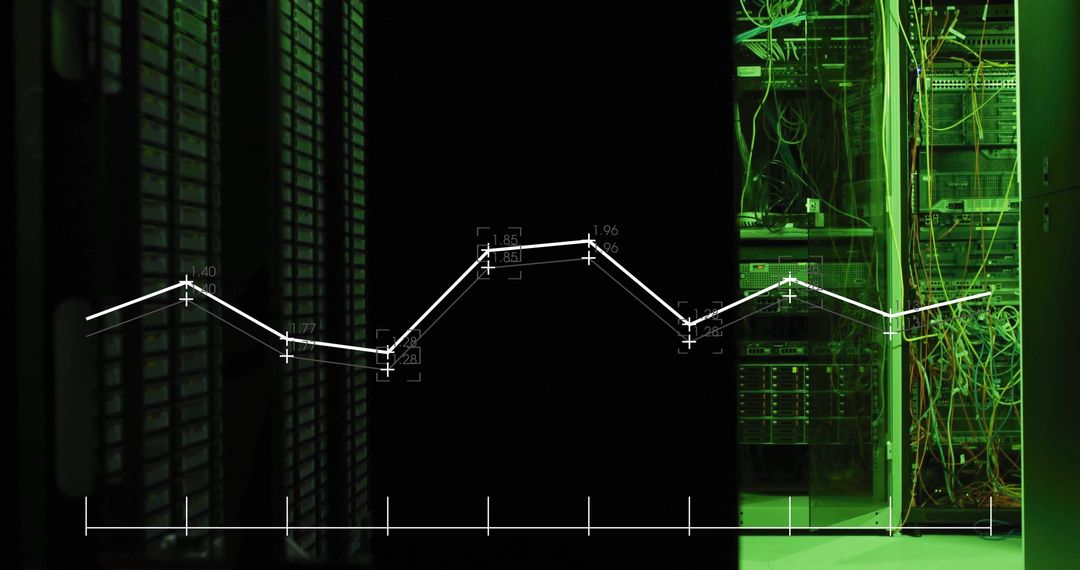
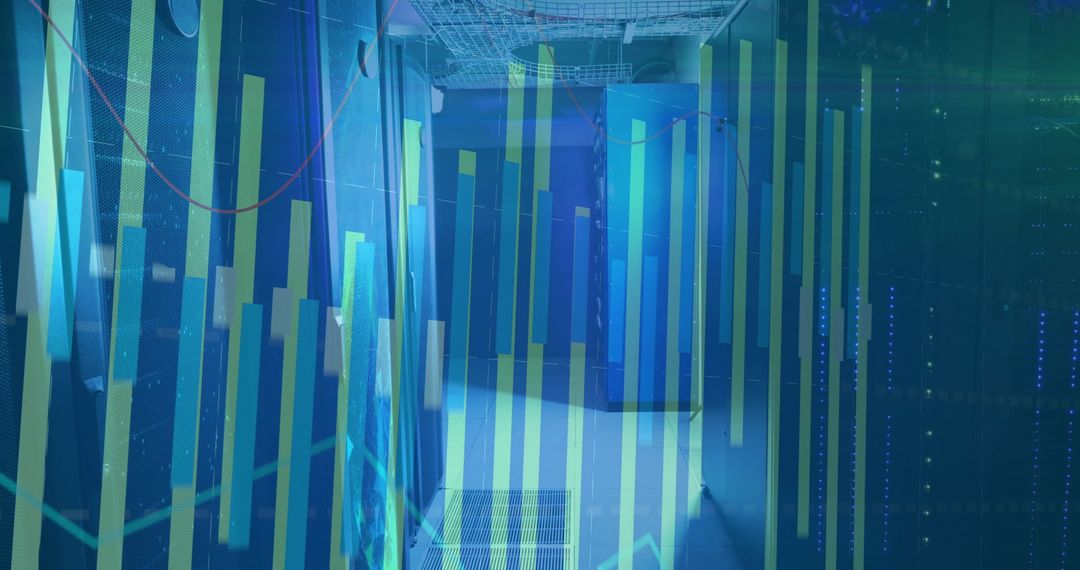
- Data Analytics Overlays on Server Room Exhaust Systems More Thumbnails
Data Analytics Overlays on Server Room Exhaust Systems More Thumbnails Image

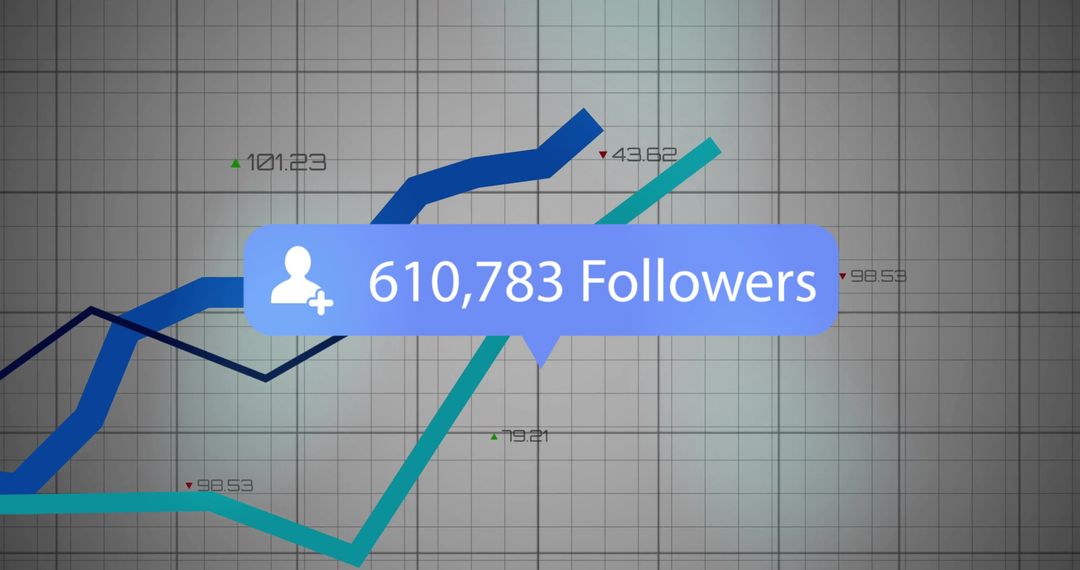
Abstract visualization merging data graphs with server elements suggests innovation and complexity, useful for illustrating data technology advances.
Powered by  - Get 15% off with code: PIKWIZARD15


0
downloads
downloads
Tags:
More
Credit Photo
If you would like to credit the Photo, here are some ways you can do so
Text Link
photo Link
<span class="text-link">
<span>
<a target="_blank" href=https://pikwizard.com/photo/data-analytics-overlays-on-server-room-exhaust-systems-more-thumbnails/26e098fe878d5626e665af13477ddfec/>PikWizard</a>
</span>
</span>
<span class="image-link">
<span
style="margin: 0 0 20px 0; display: inline-block; vertical-align: middle; width: 100%;"
>
<a
target="_blank"
href="https://pikwizard.com/photo/data-analytics-overlays-on-server-room-exhaust-systems-more-thumbnails/26e098fe878d5626e665af13477ddfec/"
style="text-decoration: none; font-size: 10px; margin: 0;"
>
<img src="https://pikwizard.com/pw/medium/26e098fe878d5626e665af13477ddfec.jpg" style="margin: 0; width: 100%;" alt="" />
<p style="font-size: 12px; margin: 0;">PikWizard</p>
</a>
</span>
</span>
Free (free of charge)
Free for personal and commercial use.
Author: Creative Art
Similar Free Stock Images