
- Home >
- Stock Photos >
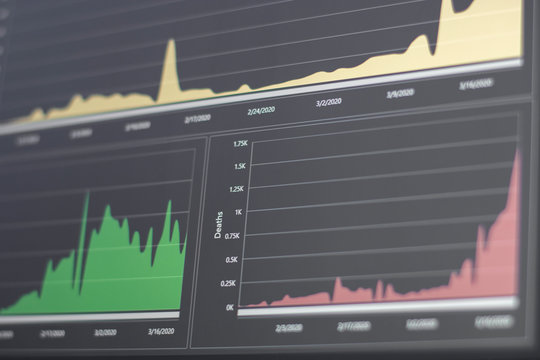
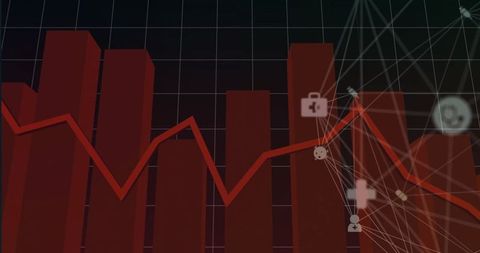
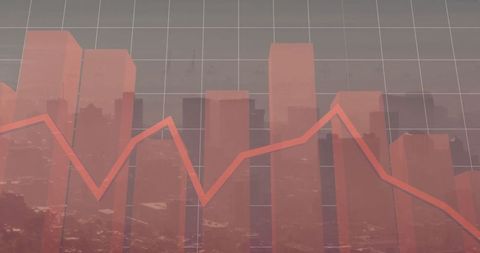
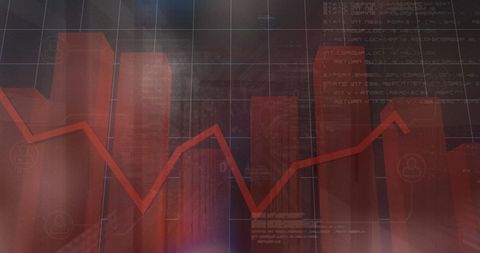
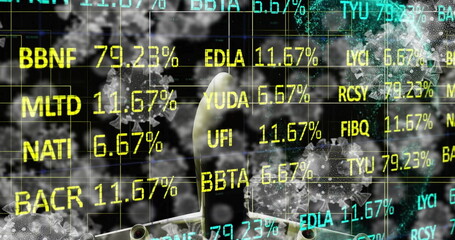
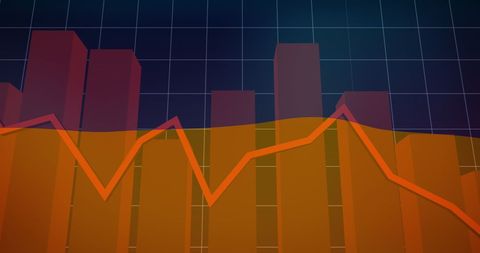
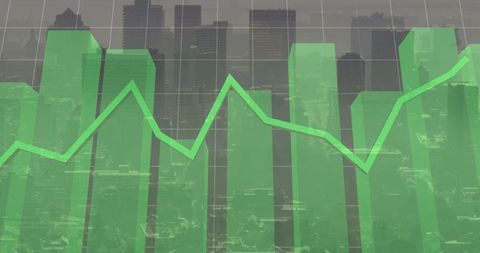
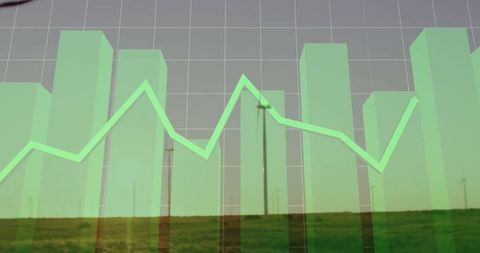
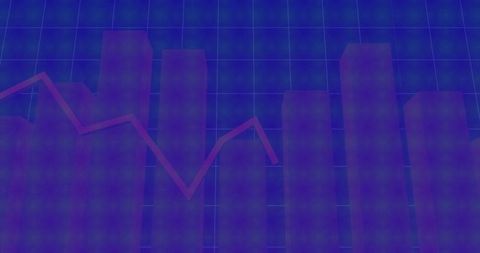
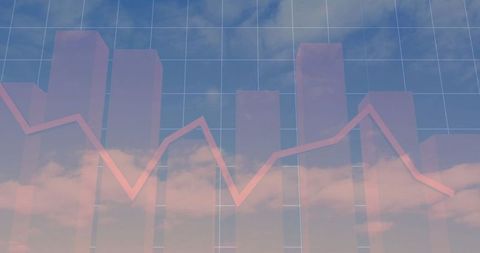
- Data Analytics Trends Amid Virus Cells Imposing Uncertainty
Data Analytics Trends Amid Virus Cells Imposing Uncertainty Image

Visualizing interaction between data trends and viral impacts, this scene impacts various industries, highlighting the uncertainty in global business and economy. Useful in analytics reports, economic reviews, and discussions on pandemic impact.
Powered by 


downloads
Tags:
More
Credit Photo
If you would like to credit the Photo, here are some ways you can do so
Text Link
photo Link
<span class="text-link">
<span>
<a target="_blank" href=https://pikwizard.com/photo/data-analytics-trends-amid-virus-cells-imposing-uncertainty/b0cdd9952ff6ee8459896214b276a203/>PikWizard</a>
</span>
</span>
<span class="image-link">
<span
style="margin: 0 0 20px 0; display: inline-block; vertical-align: middle; width: 100%;"
>
<a
target="_blank"
href="https://pikwizard.com/photo/data-analytics-trends-amid-virus-cells-imposing-uncertainty/b0cdd9952ff6ee8459896214b276a203/"
style="text-decoration: none; font-size: 10px; margin: 0;"
>
<img src="https://pikwizard.com/pw/medium/b0cdd9952ff6ee8459896214b276a203.jpg" style="margin: 0; width: 100%;" alt="" />
<p style="font-size: 12px; margin: 0;">PikWizard</p>
</a>
</span>
</span>
Free (free of charge)
Free for personal and commercial use.
Author: Creative Art
Similar Free Stock Images
Loading...

Premium


Premium


Premium


Premium


Premium


Premium


Premium


Premium


Premium


Premium


Premium


Premium


Premium


Premium

Premium


Premium


Premium


Premium


Premium


Premium


Premium


Premium


Premium


Premium

Premium

Explore More Free Stock Images