
- Home >
- Stock Photos >
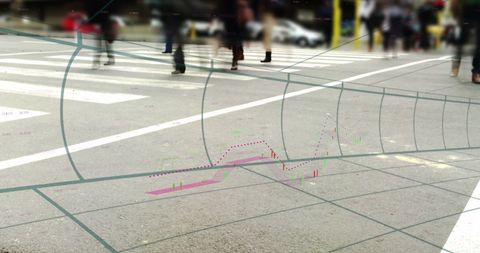
- Data Analytics Visual with Growing Trend Arrow
Data Analytics Visual with Growing Trend Arrow Image

Abstract digital illustration featuring data processing with growing trend arrow. Visual elements include numeric displays, geometric shapes, and abstract designs indicating analytics and global business. Ideal for use in presentations, reports, or any digital content focused on illustrating data growth, market trends, and analytics visualization.
Powered by  - Get 15% off with code: PIKWIZARD15


downloads
Tags:
More
Credit Photo
If you would like to credit the Photo, here are some ways you can do so
Text Link
photo Link
<span class="text-link">
<span>
<a target="_blank" href=https://pikwizard.com/photo/data-analytics-visual-with-growing-trend-arrow/652c69aa8b22341017ca5a62303d4917/>PikWizard</a>
</span>
</span>
<span class="image-link">
<span
style="margin: 0 0 20px 0; display: inline-block; vertical-align: middle; width: 100%;"
>
<a
target="_blank"
href="https://pikwizard.com/photo/data-analytics-visual-with-growing-trend-arrow/652c69aa8b22341017ca5a62303d4917/"
style="text-decoration: none; font-size: 10px; margin: 0;"
>
<img src="https://pikwizard.com/pw/medium/652c69aa8b22341017ca5a62303d4917.jpg" style="margin: 0; width: 100%;" alt="" />
<p style="font-size: 12px; margin: 0;">PikWizard</p>
</a>
</span>
</span>
Free (free of charge)
Free for personal and commercial use.
Author: Awesome Content
Similar Free Stock Images

Premium


Premium


Premium


Premium


Premium


Premium


Premium


Premium


Premium


Premium


Premium


Premium


Premium


Premium


Premium

Premium


Premium


Premium


Premium


Premium


Premium


Premium


Premium


Premium


Premium


Explore More Free Stock Images