
- Home >
- Stock Photos >
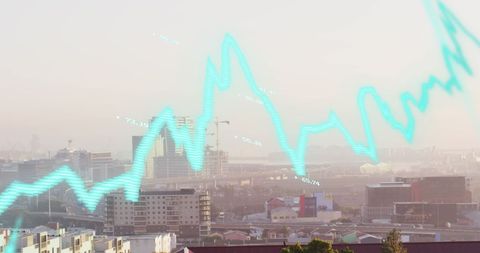
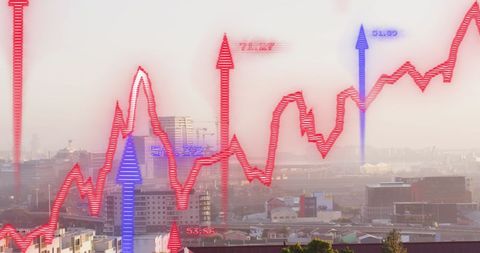
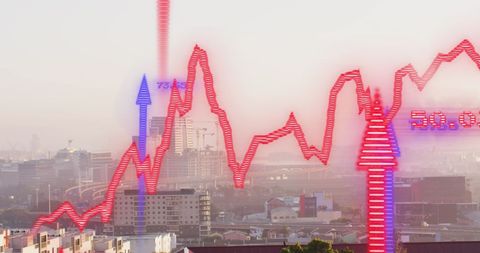
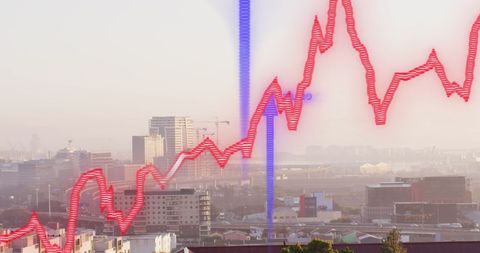
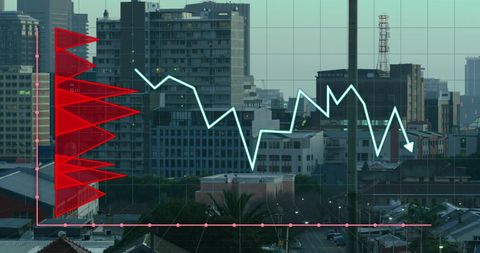
- Data Analytics Visualization Over Urban Construction Site
Data Analytics Visualization Over Urban Construction Site Image

This striking composition shows a vivid red line graph layered over the silhouette of an urban construction site, symbolizing the convergence of data analytics and city development. Perfect for illustrating global business advancements, digital transformation, smart city evolution, and strategic growth interpretations in modern world discussions. Useful for financial reports, technology newsletters, and urban development projects.
Powered by 


downloads
Tags:
More
Credit Photo
If you would like to credit the Photo, here are some ways you can do so
Text Link
photo Link
<span class="text-link">
<span>
<a target="_blank" href=https://pikwizard.com/photo/data-analytics-visualization-over-urban-construction-site/cf340116c2ceb8fc31b23312c49c57a3/>PikWizard</a>
</span>
</span>
<span class="image-link">
<span
style="margin: 0 0 20px 0; display: inline-block; vertical-align: middle; width: 100%;"
>
<a
target="_blank"
href="https://pikwizard.com/photo/data-analytics-visualization-over-urban-construction-site/cf340116c2ceb8fc31b23312c49c57a3/"
style="text-decoration: none; font-size: 10px; margin: 0;"
>
<img src="https://pikwizard.com/pw/medium/cf340116c2ceb8fc31b23312c49c57a3.jpg" style="margin: 0; width: 100%;" alt="" />
<p style="font-size: 12px; margin: 0;">PikWizard</p>
</a>
</span>
</span>
Free (free of charge)
Free for personal and commercial use.
Author: Creative Art
Similar Free Stock Images

Premium


Premium


Premium


Premium


Premium


Premium


Premium


Premium


Premium


Premium


Premium


Premium


Premium

Premium


Premium


Premium


Premium

Premium

Premium


Premium


Premium

Premium


Premium

Premium


Premium


Explore More Free Stock Images