- Home >
- Stock Photos >
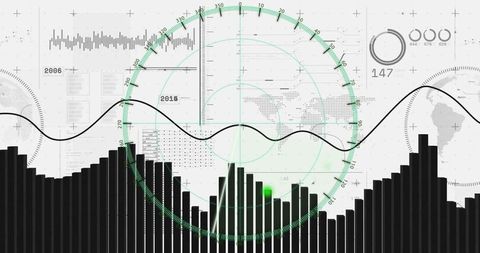
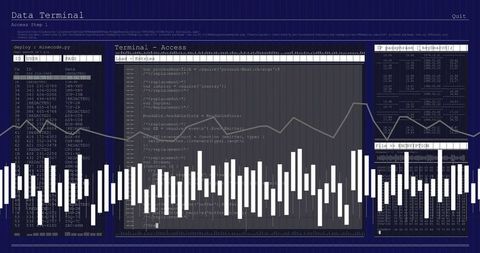
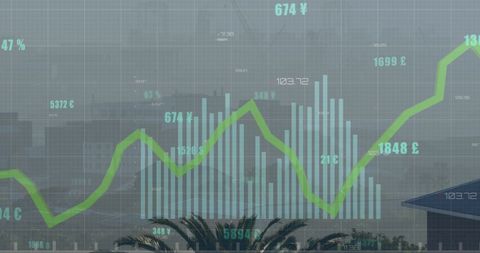
- Data Analytics Visualization with Graphs and Charts
Data Analytics Visualization with Graphs and Charts Image

Image depicts digital visualization of data analytics with various graphs and charts over white background. Effective for presentations on business finance, market analysis, and global data strategies. Ideal for websites and reports focusing on finance, technology, and digital interfaces.

downloads
Tags:
More
Credit Photo
If you would like to credit the Photo, here are some ways you can do so
Text Link
photo Link
<span class="text-link">
<span>
<a target="_blank" href=https://pikwizard.com/photo/data-analytics-visualization-with-graphs-and-charts/44ad2db8e780e5758d851cde3bd282b2/>PikWizard</a>
</span>
</span>
<span class="image-link">
<span
style="margin: 0 0 20px 0; display: inline-block; vertical-align: middle; width: 100%;"
>
<a
target="_blank"
href="https://pikwizard.com/photo/data-analytics-visualization-with-graphs-and-charts/44ad2db8e780e5758d851cde3bd282b2/"
style="text-decoration: none; font-size: 10px; margin: 0;"
>
<img src="https://pikwizard.com/pw/medium/44ad2db8e780e5758d851cde3bd282b2.jpg" style="margin: 0; width: 100%;" alt="" />
<p style="font-size: 12px; margin: 0;">PikWizard</p>
</a>
</span>
</span>
Free (free of charge)
Free for personal and commercial use.
Author: Creative Art