
- Home >
- Stock Photos >
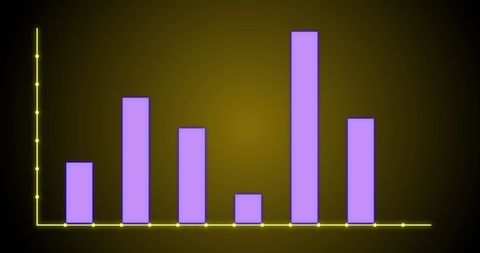
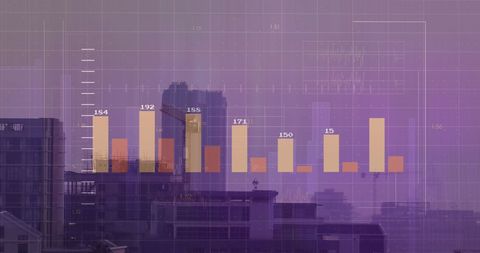
- Data Analytics with Barchart Over Abstract Background
Data Analytics with Barchart Over Abstract Background Image

Illustration of a barchart on an abstract brown background. Represents data analytics and statistical analysis. Useful for illustrating concepts in data science, technology presentations, and information technology marketing materials.
Powered by 


downloads
Tags:
More
Credit Photo
If you would like to credit the Photo, here are some ways you can do so
Text Link
photo Link
<span class="text-link">
<span>
<a target="_blank" href=https://pikwizard.com/photo/data-analytics-with-barchart-over-abstract-background/ef32670bd76c33ed37e38d2f5dd23636/>PikWizard</a>
</span>
</span>
<span class="image-link">
<span
style="margin: 0 0 20px 0; display: inline-block; vertical-align: middle; width: 100%;"
>
<a
target="_blank"
href="https://pikwizard.com/photo/data-analytics-with-barchart-over-abstract-background/ef32670bd76c33ed37e38d2f5dd23636/"
style="text-decoration: none; font-size: 10px; margin: 0;"
>
<img src="https://pikwizard.com/pw/medium/ef32670bd76c33ed37e38d2f5dd23636.jpg" style="margin: 0; width: 100%;" alt="" />
<p style="font-size: 12px; margin: 0;">PikWizard</p>
</a>
</span>
</span>
Free (free of charge)
Free for personal and commercial use.
Author: Authentic Images
Similar Free Stock Images

Premium


Premium

Premium


Premium

Premium


Premium


Premium


Premium


Premium


Premium


Premium


Premium


Premium


Premium


Premium


Premium

Premium


Premium


Premium


Premium


Premium


Premium


Premium


Premium


Premium

Explore More Free Stock Images