
- Home >
- Stock Photos >
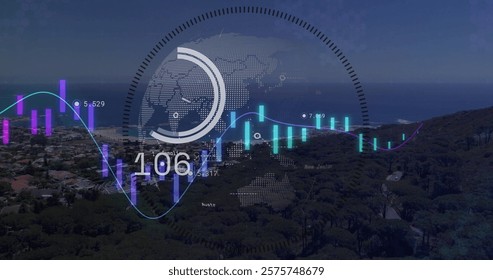
- Data Analytics with Statistical Graphs and Digital Globe Overlay
Data Analytics with Statistical Graphs and Digital Globe Overlay Image

Data analytics themed illustration combining graphs, statistics, and a globe. Perfect for use in technology, finance, and educational content to emphasize global business analysis and data visualization concepts.
Powered by  - Get 15% off with code: PIKWIZARD15


downloads
Tags:
More
Credit Photo
If you would like to credit the Photo, here are some ways you can do so
Text Link
photo Link
<span class="text-link">
<span>
<a target="_blank" href=https://pikwizard.com/photo/data-analytics-with-statistical-graphs-and-digital-globe-overlay/32bdd1270f4a9fae9a5a1ffc693317d0/>PikWizard</a>
</span>
</span>
<span class="image-link">
<span
style="margin: 0 0 20px 0; display: inline-block; vertical-align: middle; width: 100%;"
>
<a
target="_blank"
href="https://pikwizard.com/photo/data-analytics-with-statistical-graphs-and-digital-globe-overlay/32bdd1270f4a9fae9a5a1ffc693317d0/"
style="text-decoration: none; font-size: 10px; margin: 0;"
>
<img src="https://pikwizard.com/pw/medium/32bdd1270f4a9fae9a5a1ffc693317d0.jpg" style="margin: 0; width: 100%;" alt="" />
<p style="font-size: 12px; margin: 0;">PikWizard</p>
</a>
</span>
</span>
Free (free of charge)
Free for personal and commercial use.
Author: Creative Art
Similar Free Stock Images

Premium


Premium

Premium


Premium


Premium


Premium


Premium


Premium


Premium

Premium

Premium


Premium


Premium


Premium


Premium


Premium


Premium


Premium


Premium


Premium

Premium


Premium


Premium


Premium


Premium


Explore More Free Stock Images