
- Home >
- Stock Photos >
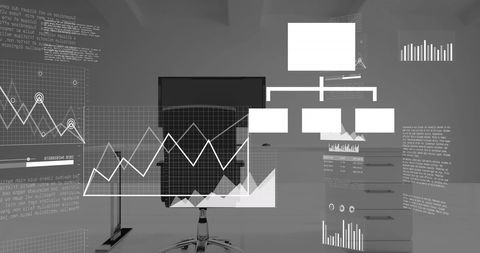
- Data And Graphs Overlayed on Office Background
Data And Graphs Overlayed on Office Background Image

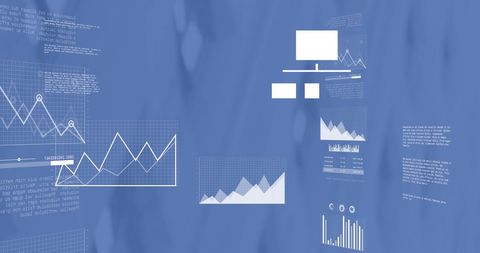
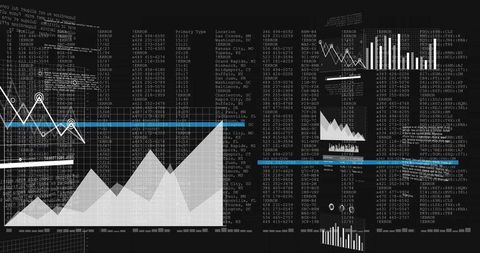
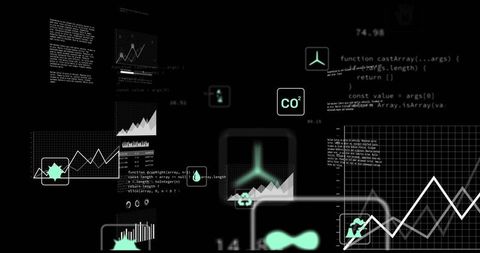
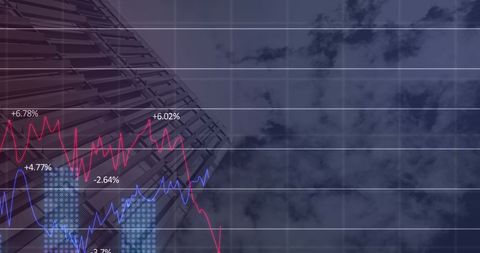
Abstract depiction of various graphs and data analytics overlays set against an out-of-focus office environment. Symbolizes digital technology in modern business enterprises, data processing, corporate evaluations, and financial statistics. Useful for editorial coverage on technology, business insights, or digital economy, and ideal for websites or presentations focused on data analysis and monetary growth trends.
Powered by 


downloads
Tags:
More
Credit Photo
If you would like to credit the Photo, here are some ways you can do so
Text Link
photo Link
<span class="text-link">
<span>
<a target="_blank" href=https://pikwizard.com/photo/data-and-graphs-overlayed-on-office-background/d8a6efbf09469ac2d9bf6b3e57934d2d/>PikWizard</a>
</span>
</span>
<span class="image-link">
<span
style="margin: 0 0 20px 0; display: inline-block; vertical-align: middle; width: 100%;"
>
<a
target="_blank"
href="https://pikwizard.com/photo/data-and-graphs-overlayed-on-office-background/d8a6efbf09469ac2d9bf6b3e57934d2d/"
style="text-decoration: none; font-size: 10px; margin: 0;"
>
<img src="https://pikwizard.com/pw/medium/d8a6efbf09469ac2d9bf6b3e57934d2d.jpg" style="margin: 0; width: 100%;" alt="" />
<p style="font-size: 12px; margin: 0;">PikWizard</p>
</a>
</span>
</span>
Free (free of charge)
Free for personal and commercial use.
Author: Authentic Images
Similar Free Stock Images

Premium


Premium

Premium


Premium


Premium


Premium


Premium


Premium


Premium

Premium

Premium


Premium


Premium


Premium


Premium


Premium


Premium


Premium


Premium


Premium


Premium


Premium

Premium


Premium


Premium


Explore More Free Stock Images