
- Home >
- Stock Photos >
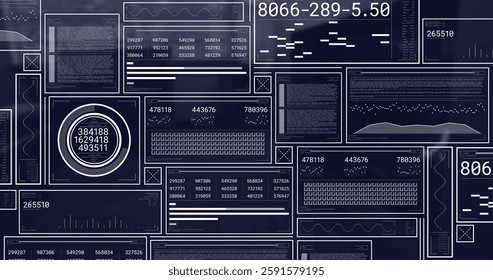
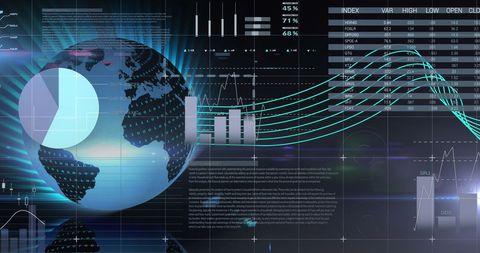
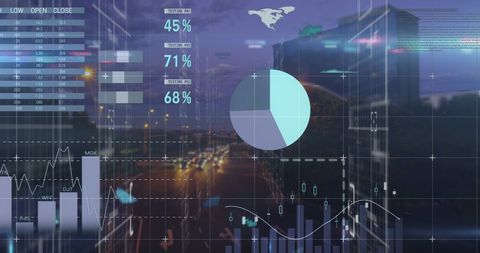
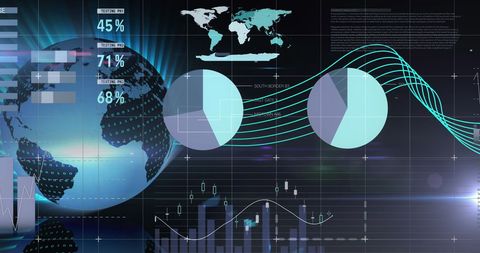
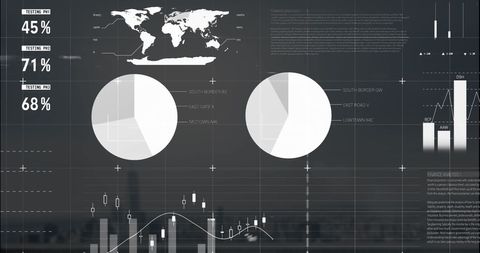
- Data and Statistics Processing on Digital Screens
Data and Statistics Processing on Digital Screens Image

Digital presentation showing data and statistics on overlays with graphical elements like charts and a global map. Excellent for technology articles focusing on global business trends, financial analytics, and data processing software promotions. Useful for illustrating technology-driven finance and science discussions.
Powered by  - Get 15% off with code: PIKWIZARD15


downloads
Tags:
More
Credit Photo
If you would like to credit the Photo, here are some ways you can do so
Text Link
photo Link
<span class="text-link">
<span>
<a target="_blank" href=https://pikwizard.com/photo/data-and-statistics-processing-on-digital-screens/93a350d9e371d60b644c67558e9958b5/>PikWizard</a>
</span>
</span>
<span class="image-link">
<span
style="margin: 0 0 20px 0; display: inline-block; vertical-align: middle; width: 100%;"
>
<a
target="_blank"
href="https://pikwizard.com/photo/data-and-statistics-processing-on-digital-screens/93a350d9e371d60b644c67558e9958b5/"
style="text-decoration: none; font-size: 10px; margin: 0;"
>
<img src="https://pikwizard.com/pw/medium/93a350d9e371d60b644c67558e9958b5.jpg" style="margin: 0; width: 100%;" alt="" />
<p style="font-size: 12px; margin: 0;">PikWizard</p>
</a>
</span>
</span>
Free (free of charge)
Free for personal and commercial use.
Author: Creative Art
Similar Free Stock Images

Premium

Premium

Premium


Premium


Premium


Premium


Premium


Premium

Premium
Premium


Premium


Premium


Premium


Premium


Premium


Premium


Premium


Premium


Premium


Premium


Premium
Premium


Premium


Premium


Premium


Explore More Free Stock Images