- Home >
- Stock Photos >
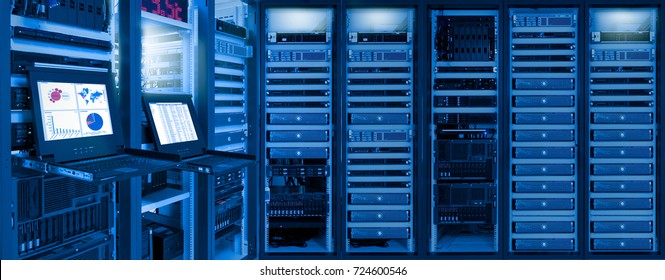
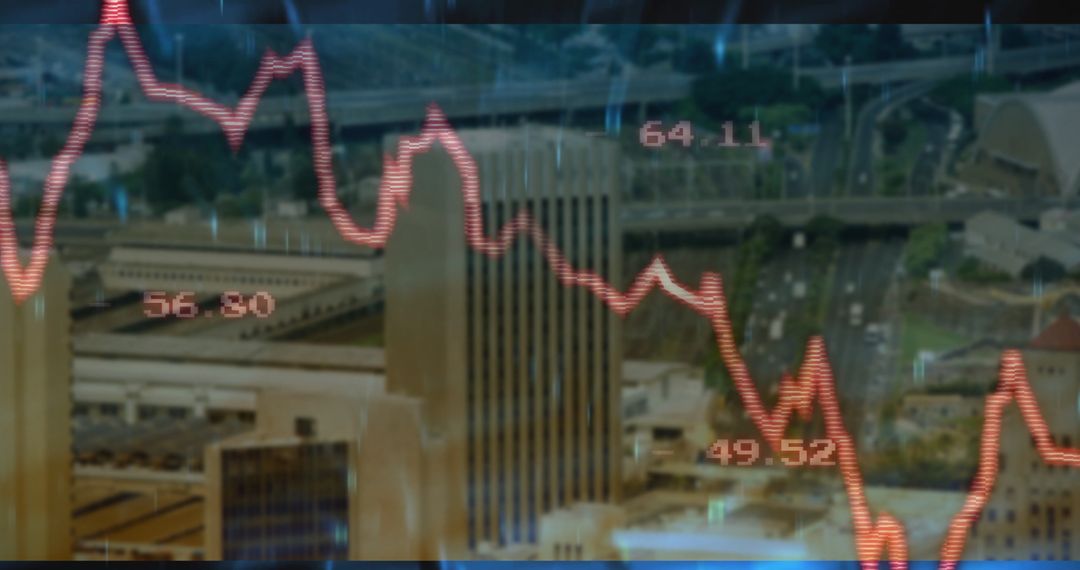
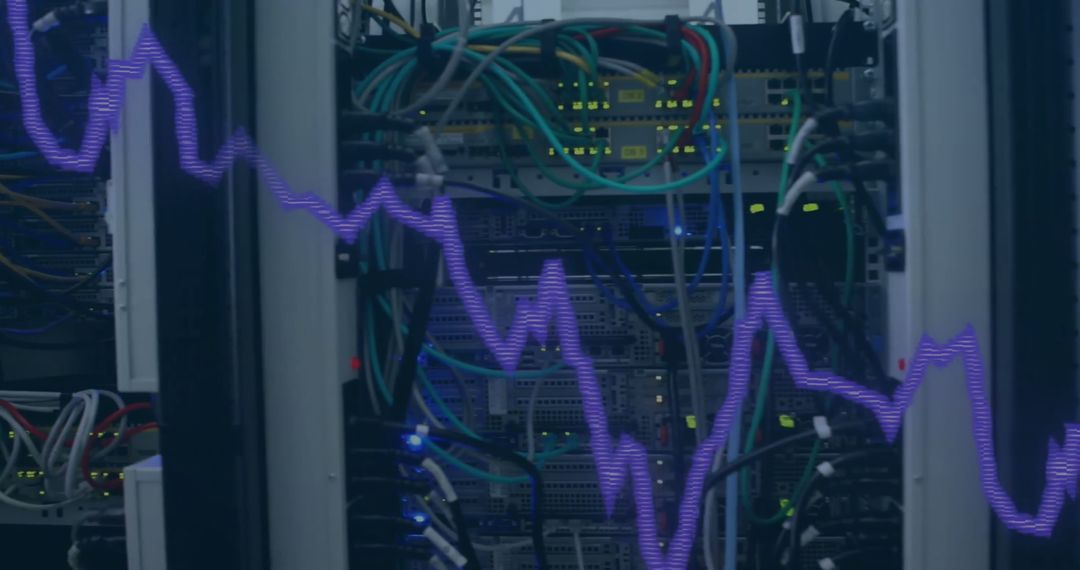
- Data Center Corridor with Floating Financial Graph
Data Center Corridor with Floating Financial Graph Image

Complex environment featuring a data center corridor with visible rows of server cabinets, representing core aspects of digital infrastructure. Overlaid financial graph illustrates technology's linkage to economic performance. Suitable for illustrating themes like cybersecurity, data management, modern business analytics, technology infrastructure, and their impact on the economy. Useful in IT business websites, technology infrastructure journals, or financial analytics backgrounds.
Powered by  - Get 15% off with code: PIKWIZARD15


2
downloads
downloads
Tags:
More
Credit Photo
If you would like to credit the Photo, here are some ways you can do so
Text Link
photo Link
<span class="text-link">
<span>
<a target="_blank" href=https://pikwizard.com/photo/data-center-corridor-with-floating-financial-graph/86533d7f761300c2552a2e0e664da50b/>PikWizard</a>
</span>
</span>
<span class="image-link">
<span
style="margin: 0 0 20px 0; display: inline-block; vertical-align: middle; width: 100%;"
>
<a
target="_blank"
href="https://pikwizard.com/photo/data-center-corridor-with-floating-financial-graph/86533d7f761300c2552a2e0e664da50b/"
style="text-decoration: none; font-size: 10px; margin: 0;"
>
<img src="https://pikwizard.com/pw/medium/86533d7f761300c2552a2e0e664da50b.jpg" style="margin: 0; width: 100%;" alt="" />
<p style="font-size: 12px; margin: 0;">PikWizard</p>
</a>
</span>
</span>
Free (free of charge)
Free for personal and commercial use.
Author: Awesome Content
Similar Free Stock Images

Premium


Premium


Premium


Premium


Premium


Premium


Premium


Premium


Premium


Premium


Premium


Premium


Premium


Premium


Premium


Premium


Premium


Premium


Premium


Premium


Premium


Premium


Premium


Premium