
- Home >
- Stock Photos >
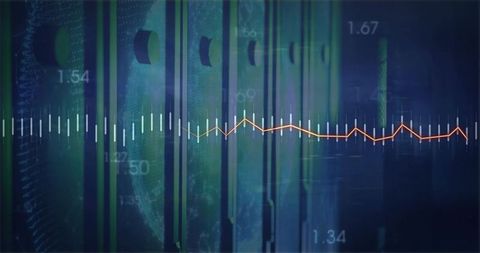
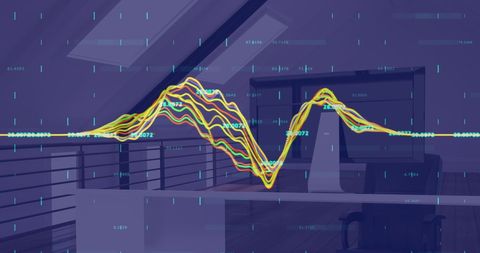
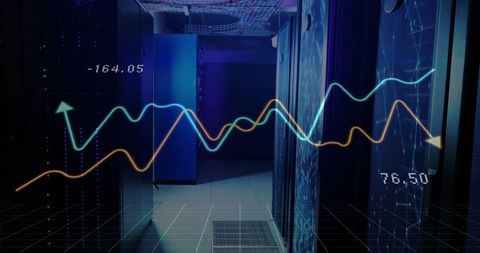
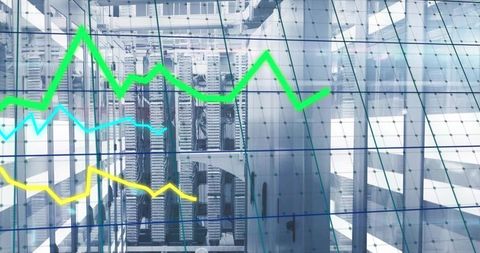
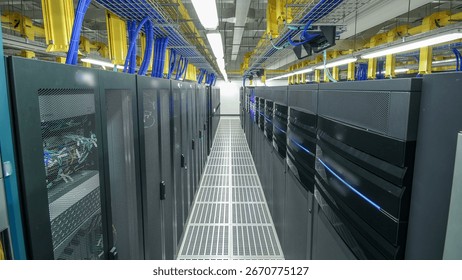
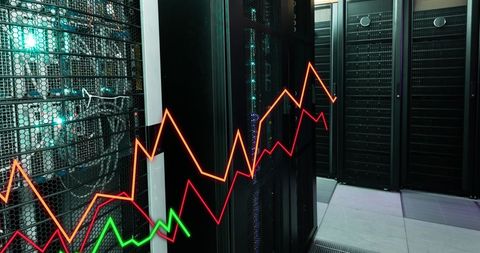
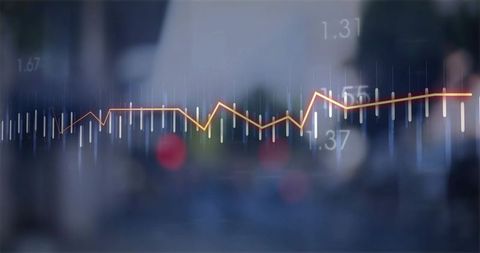
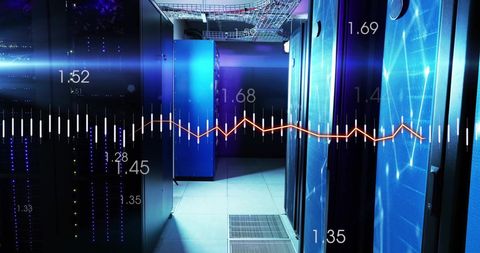
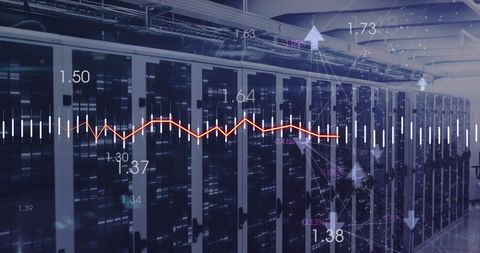
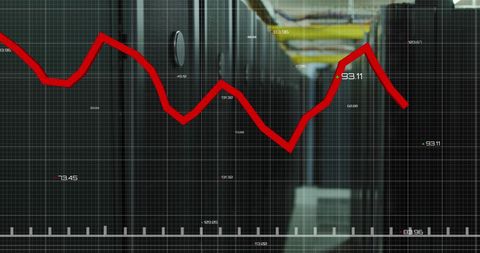
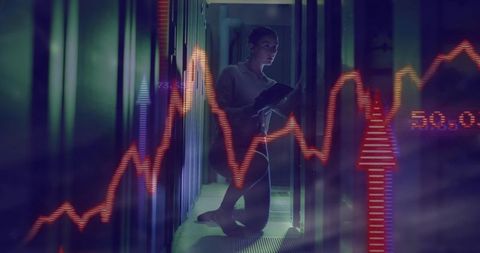
- Data Center Digital Analysis with Candlestick Overlay
Data Center Digital Analysis with Candlestick Overlay Image
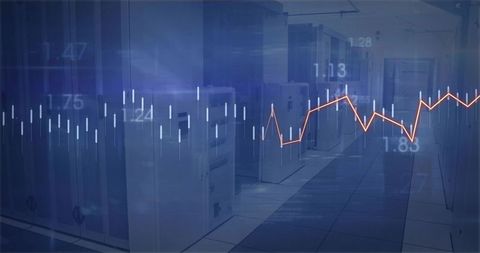
This image shows an advanced data center with servers visible along a corridor. The overlay of an orange candlestick chart signifies analysis and data fluctuations, making it useful for articles and presentations about data management, cybersecurity, technology innovations, and network infrastructure. It illustrates the dynamic nature of digital information and can be used in media covering technological trends and data analytics.
Powered by  - Get 15% off with code: PIKWIZARD15


downloads
Tags:
More
Credit Photo
If you would like to credit the Photo, here are some ways you can do so
Text Link
photo Link
<span class="text-link">
<span>
<a target="_blank" href=https://pikwizard.com/photo/data-center-digital-analysis-with-candlestick-overlay/b759f7f157dd57a7cc115f1066ae4271/>PikWizard</a>
</span>
</span>
<span class="image-link">
<span
style="margin: 0 0 20px 0; display: inline-block; vertical-align: middle; width: 100%;"
>
<a
target="_blank"
href="https://pikwizard.com/photo/data-center-digital-analysis-with-candlestick-overlay/b759f7f157dd57a7cc115f1066ae4271/"
style="text-decoration: none; font-size: 10px; margin: 0;"
>
<img src="https://pikwizard.com/pw/medium/b759f7f157dd57a7cc115f1066ae4271.jpg" style="margin: 0; width: 100%;" alt="" />
<p style="font-size: 12px; margin: 0;">PikWizard</p>
</a>
</span>
</span>
Free (free of charge)
Free for personal and commercial use.
Author: Creative Art
Similar Free Stock Images

Premium


Premium


Premium


Premium


Premium


Premium

Premium


Premium
Premium

Premium


Premium

Premium


Premium


Premium

Premium

Premium


Premium

Premium

Premium


Premium


Premium


Premium

Premium

Premium


Premium

Explore More Free Stock Images