- Home >
- Stock Photos >
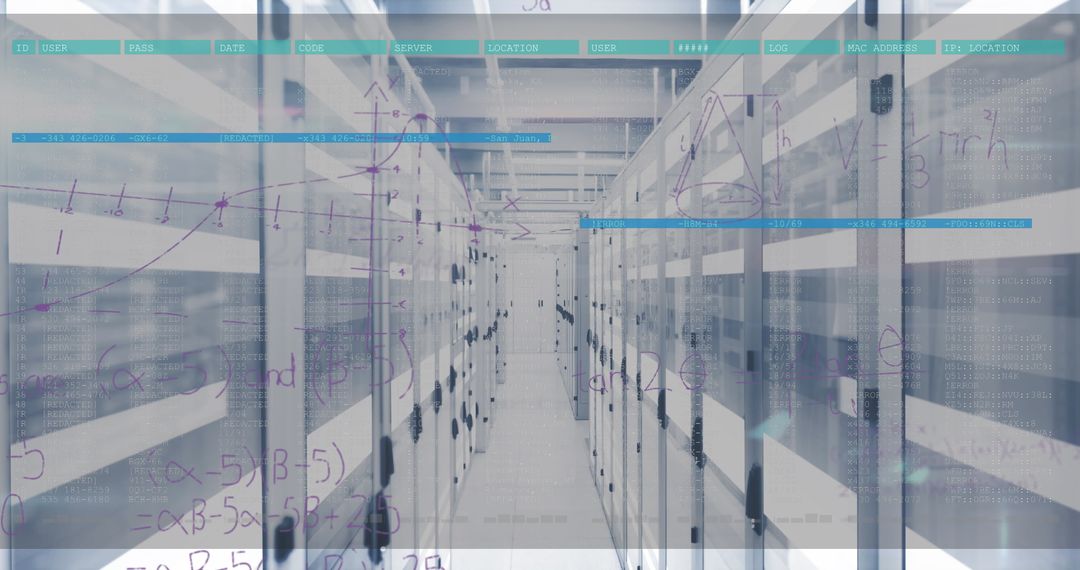
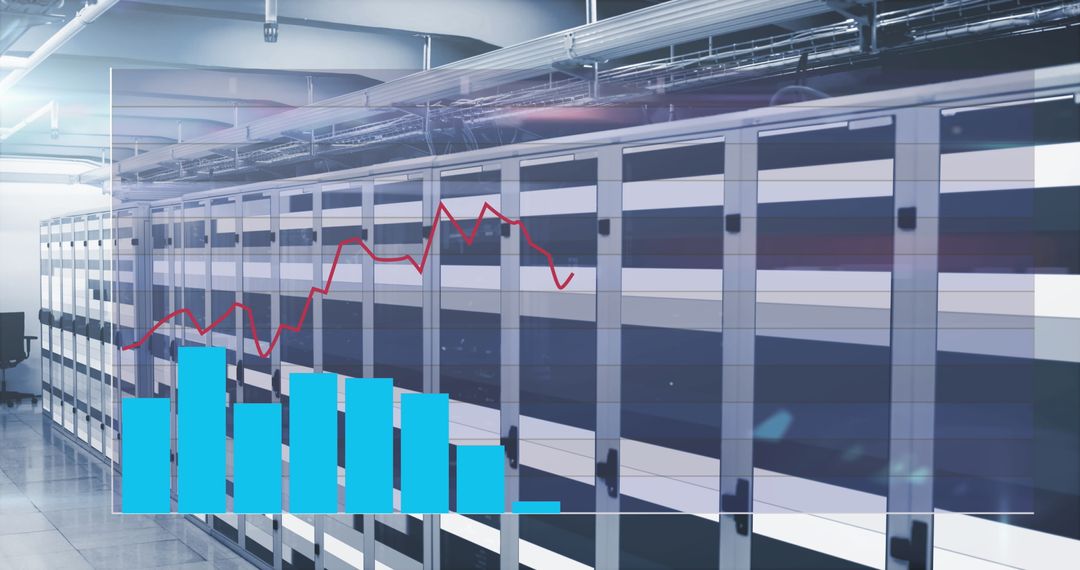
- Data Center Servers with Overlaid Financial Graphs and Analytics
Data Center Servers with Overlaid Financial Graphs and Analytics Image

Depicts server racks with an overlaid line graph representing financial analytics. Useful for illustrating concepts related to data processing, technological infrastructure, or global networks in digital economy contexts, particularly for business, finance, or information technology sectors.
Powered by 


0
downloads
downloads
Tags:
More
Credit Photo
If you would like to credit the Photo, here are some ways you can do so
Text Link
photo Link
<span class="text-link">
<span>
<a target="_blank" href=https://pikwizard.com/photo/data-center-servers-with-overlaid-financial-graphs-and-analytics/1875251e083ad738a81a5421887d224d/>PikWizard</a>
</span>
</span>
<span class="image-link">
<span
style="margin: 0 0 20px 0; display: inline-block; vertical-align: middle; width: 100%;"
>
<a
target="_blank"
href="https://pikwizard.com/photo/data-center-servers-with-overlaid-financial-graphs-and-analytics/1875251e083ad738a81a5421887d224d/"
style="text-decoration: none; font-size: 10px; margin: 0;"
>
<img src="https://pikwizard.com/pw/medium/1875251e083ad738a81a5421887d224d.jpg" style="margin: 0; width: 100%;" alt="" />
<p style="font-size: 12px; margin: 0;">PikWizard</p>
</a>
</span>
</span>
Free (free of charge)
Free for personal and commercial use.
Author: Authentic Images
Similar Free Stock Images

Premium


Premium


Premium


Premium


Premium


Premium


Premium


Premium


Premium


Premium


Premium


Premium


Premium


Premium


Premium


Premium


Premium


Premium


Premium


Premium


Premium


Premium


Premium


Premium