- Home >
- Stock Photos >
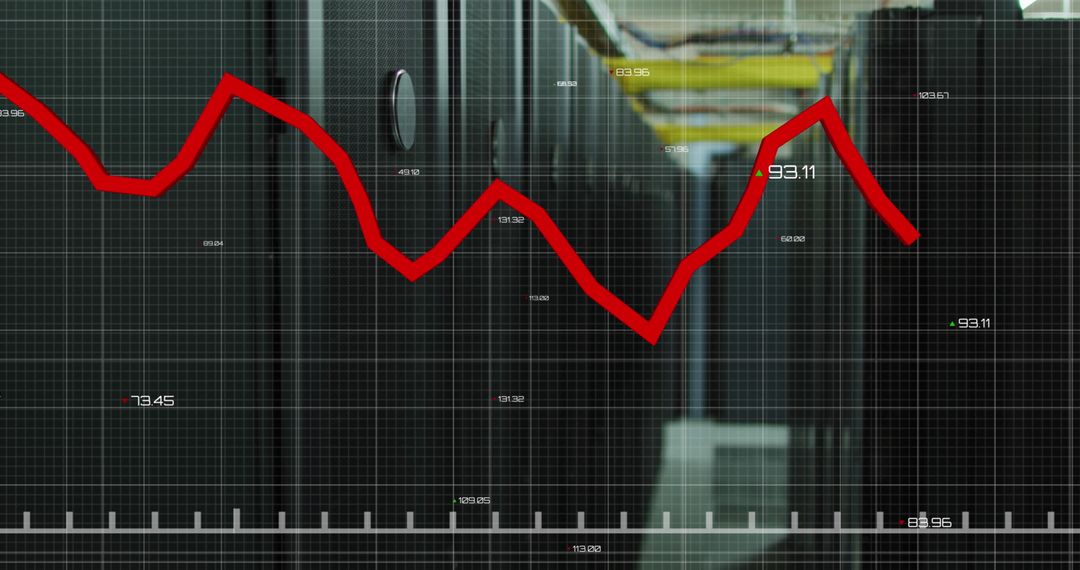
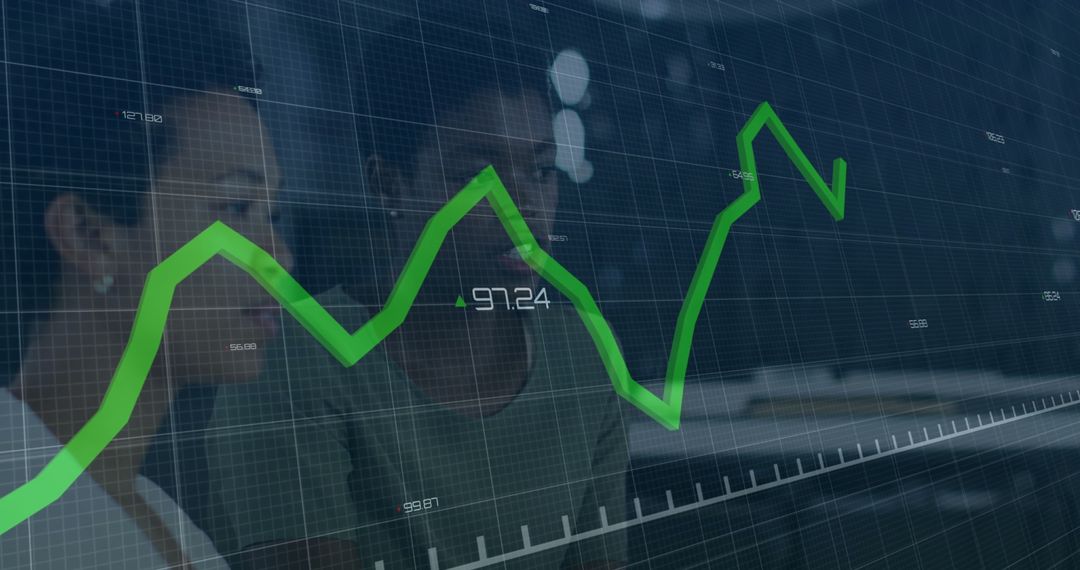
- Data Center with Rising Trends on Digital Graph
Data Center with Rising Trends on Digital Graph Image

Illustration showcasing digital trends and analytics through a graph superimposed on a peripherally lit server room. Ideal for presentations on financial growth, tech innovations, network infrastructure, and data analytics strategies. Suitable for publications focused on business intelligence, technology advancements, or computing systems.
Powered by 


0
downloads
downloads
Tags:
More
Credit Photo
If you would like to credit the Photo, here are some ways you can do so
Text Link
photo Link
<span class="text-link">
<span>
<a target="_blank" href=https://pikwizard.com/photo/data-center-with-rising-trends-on-digital-graph/d4cf506a7665c2daf8c1b28026a48c78/>PikWizard</a>
</span>
</span>
<span class="image-link">
<span
style="margin: 0 0 20px 0; display: inline-block; vertical-align: middle; width: 100%;"
>
<a
target="_blank"
href="https://pikwizard.com/photo/data-center-with-rising-trends-on-digital-graph/d4cf506a7665c2daf8c1b28026a48c78/"
style="text-decoration: none; font-size: 10px; margin: 0;"
>
<img src="https://pikwizard.com/pw/medium/d4cf506a7665c2daf8c1b28026a48c78.jpg" style="margin: 0; width: 100%;" alt="" />
<p style="font-size: 12px; margin: 0;">PikWizard</p>
</a>
</span>
</span>
Free (free of charge)
Free for personal and commercial use.
Author: Creative Art
Similar Free Stock Images

Premium


Premium


Premium


Premium


Premium


Premium


Premium


Premium


Premium


Premium


Premium


Premium


Premium


Premium


Premium


Premium


Premium


Premium


Premium


Premium


Premium


Premium


Premium


Premium