- Home >
- Stock Photos >
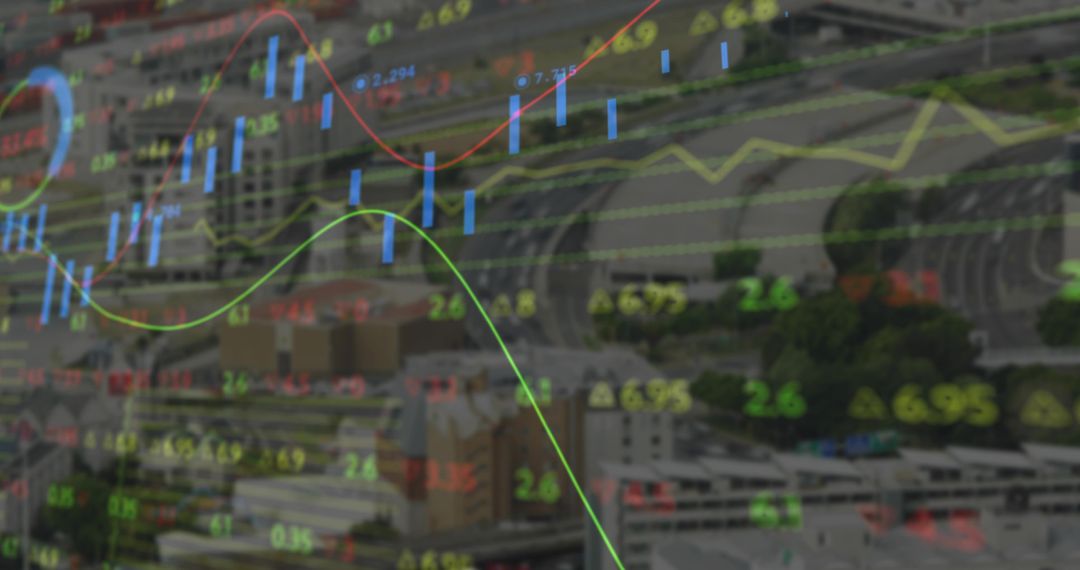
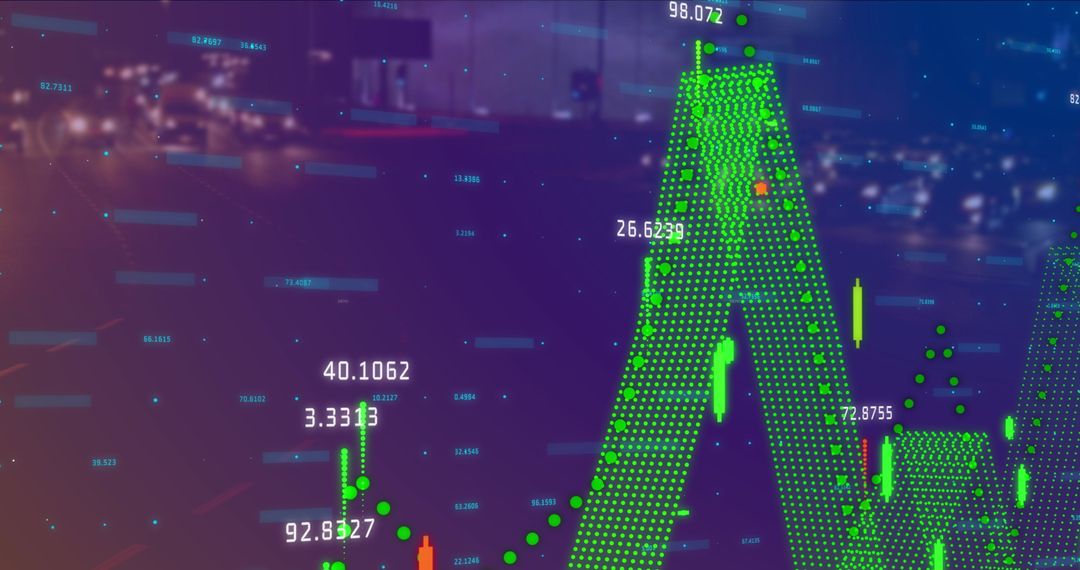
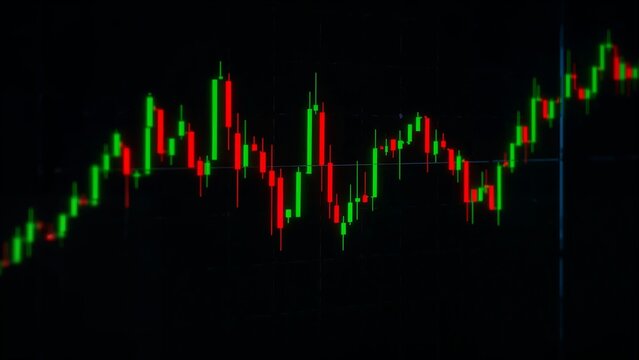
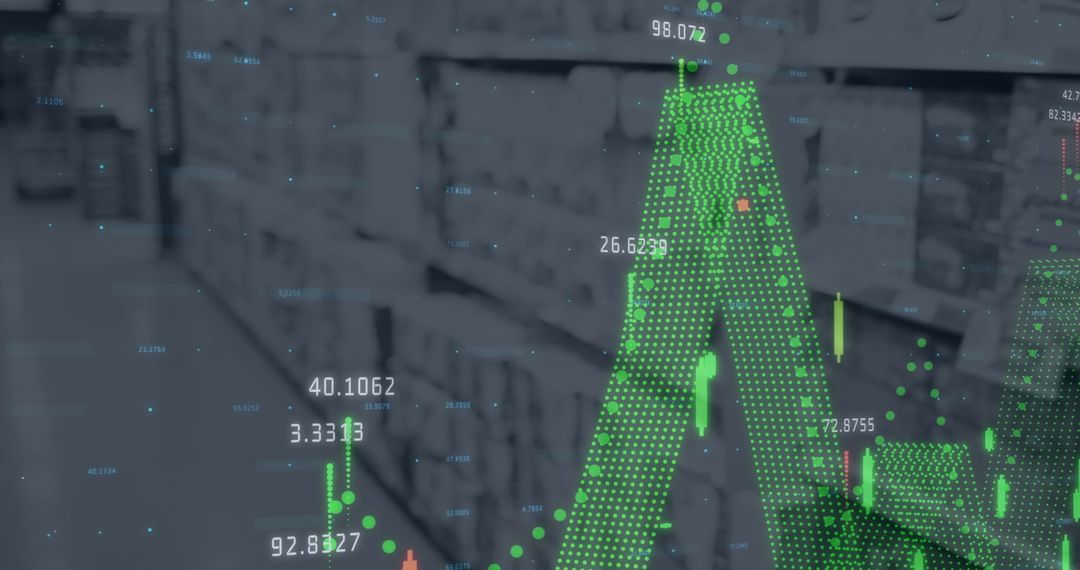
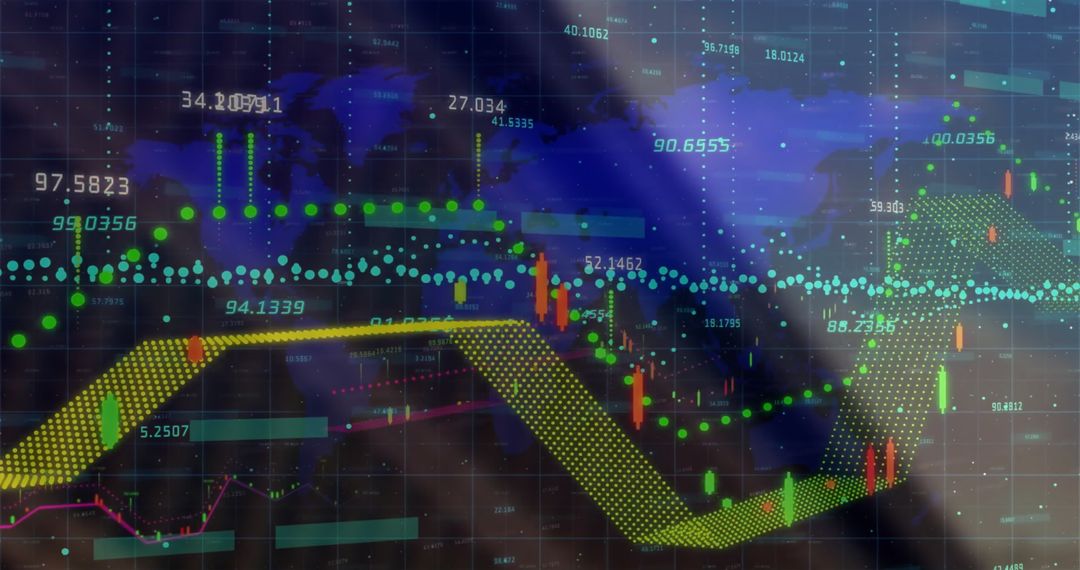
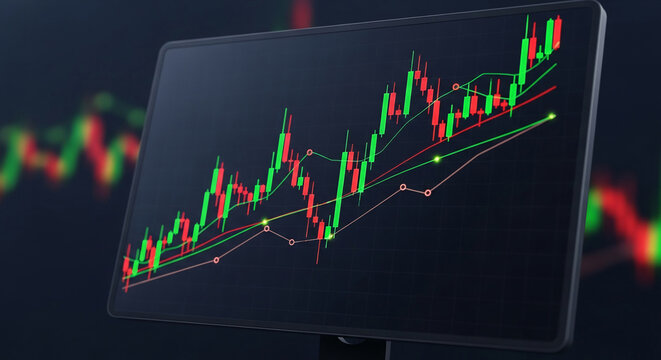
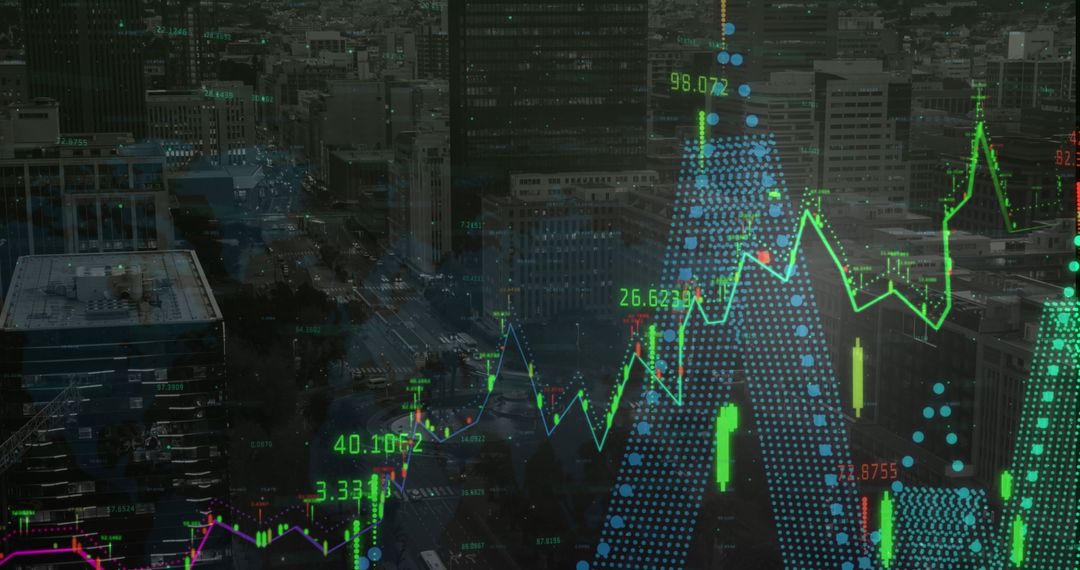
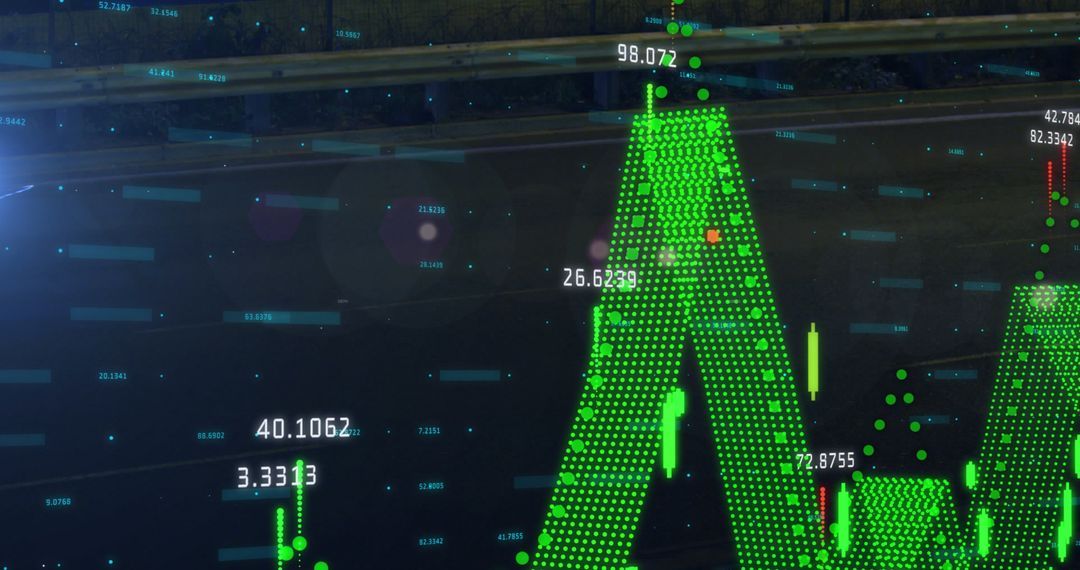
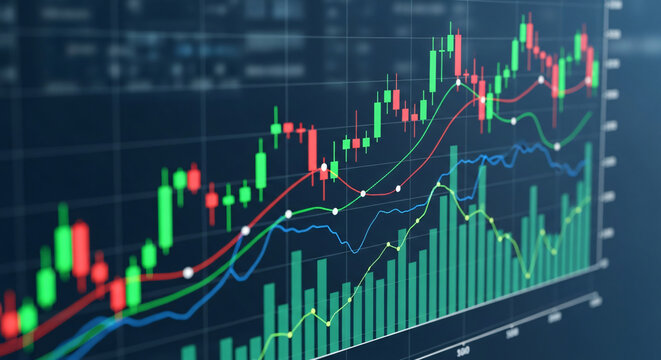
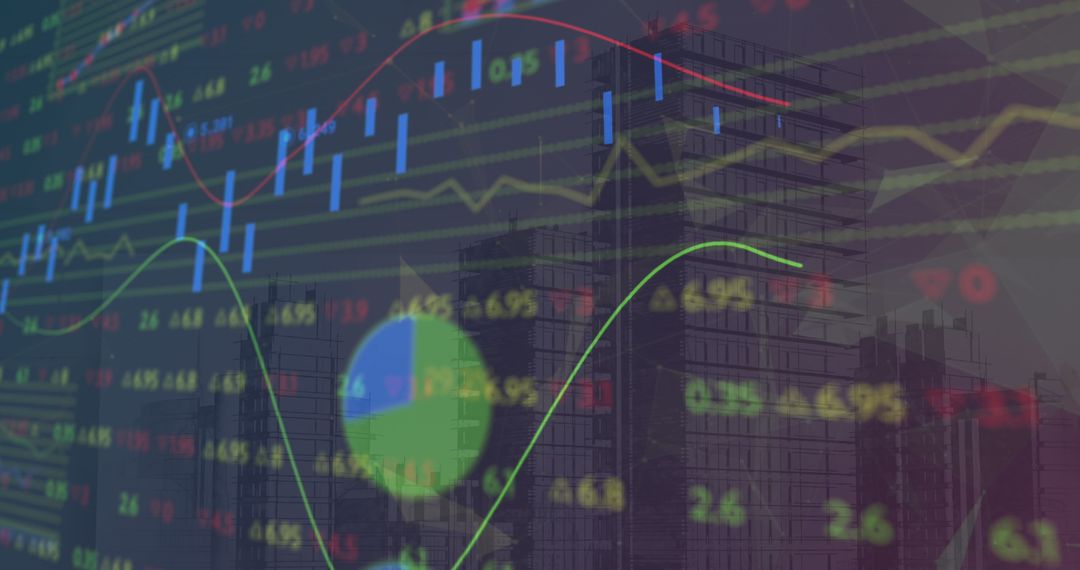
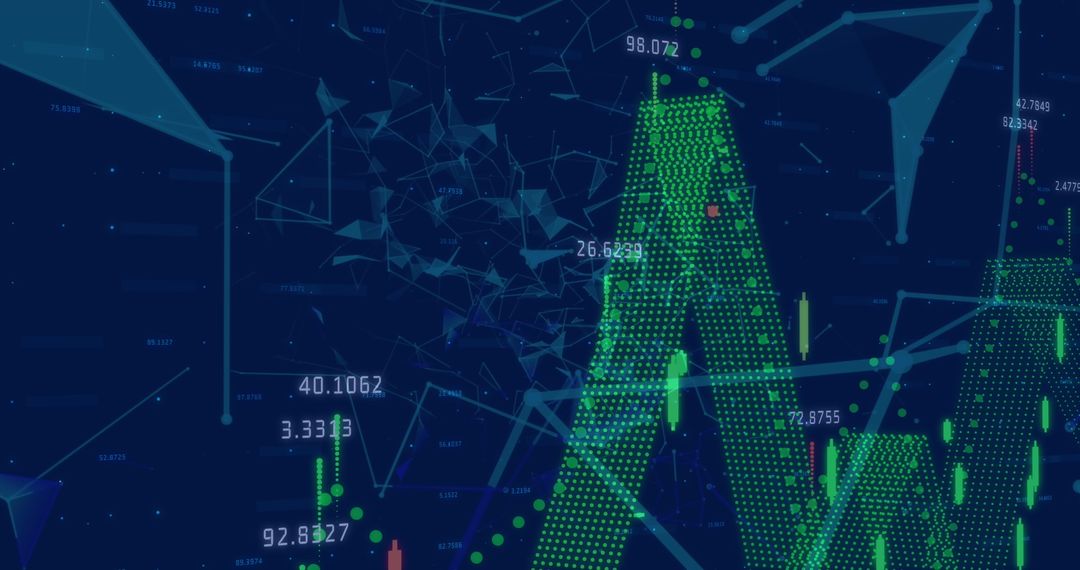
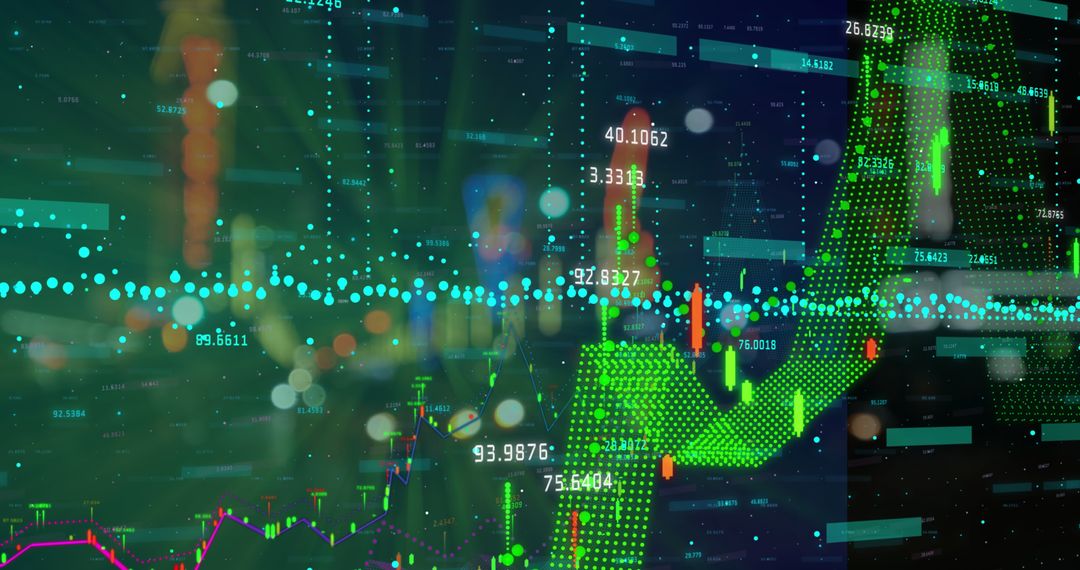
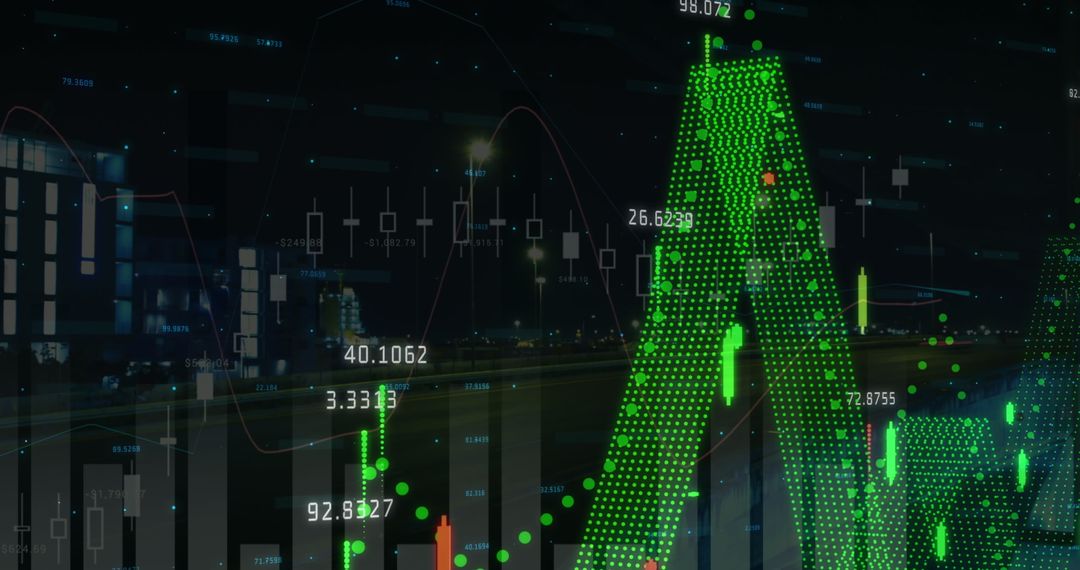
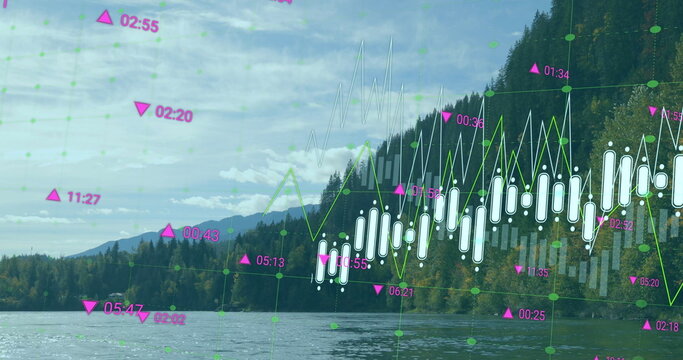
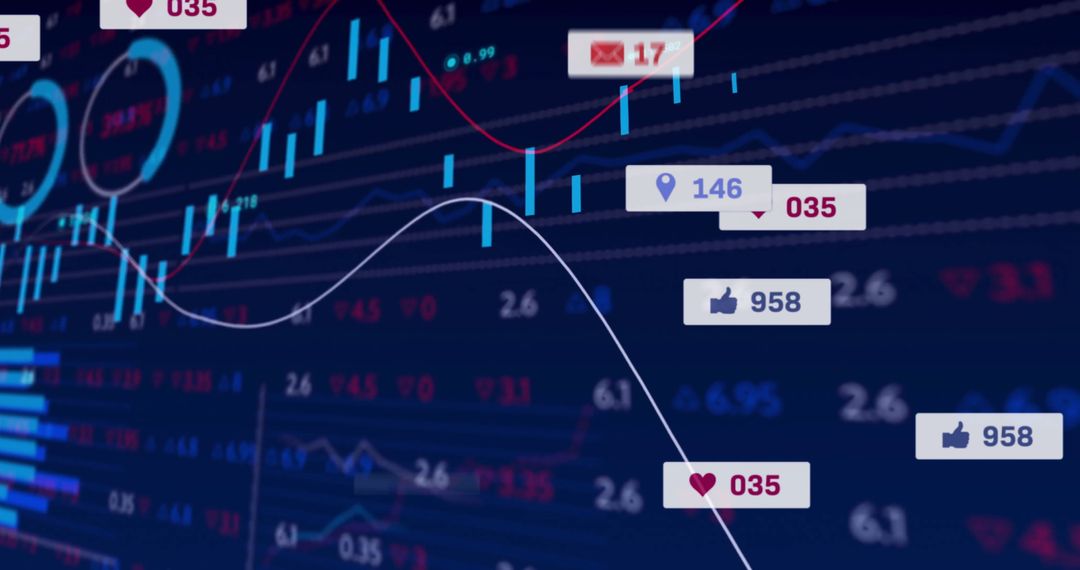
- Data Dashboard with Rising Green Graph and Candlestick Analysis
Data Dashboard with Rising Green Graph and Candlestick Analysis Image
Visualization encapsulating financial trends with green line graph and candlestick bars, useful for presentations on market analysis or data-driven investment strategies. Perfect for websites and blogs about finance, analytics, or innovative technology solutions in entrepreneurship and out-of-box strategizing.
Powered by 


0
downloads
downloads
Tags:
More
Credit Photo
If you would like to credit the Photo, here are some ways you can do so
Text Link
photo Link
<span class="text-link">
<span>
<a target="_blank" href=https://pikwizard.com/photo/data-dashboard-with-rising-green-graph-and-candlestick-analysis/f6aaa215d4beaa7b5b55b7df848c490b/>PikWizard</a>
</span>
</span>
<span class="image-link">
<span
style="margin: 0 0 20px 0; display: inline-block; vertical-align: middle; width: 100%;"
>
<a
target="_blank"
href="https://pikwizard.com/photo/data-dashboard-with-rising-green-graph-and-candlestick-analysis/f6aaa215d4beaa7b5b55b7df848c490b/"
style="text-decoration: none; font-size: 10px; margin: 0;"
>
<img src="https://pikwizard.com/pw/medium/f6aaa215d4beaa7b5b55b7df848c490b.jpg" style="margin: 0; width: 100%;" alt="" />
<p style="font-size: 12px; margin: 0;">PikWizard</p>
</a>
</span>
</span>
Free (free of charge)
Free for personal and commercial use.
Author: Awesome Content
Similar Free Stock Images
Premium


Premium


Premium


Premium
Premium


Premium


Premium


Premium


Premium


Premium


Premium


Premium


Premium


Premium


Premium


Premium

Premium
Premium


Premium


Premium


Premium


Premium


Premium


Premium