- Home >
- Stock Photos >
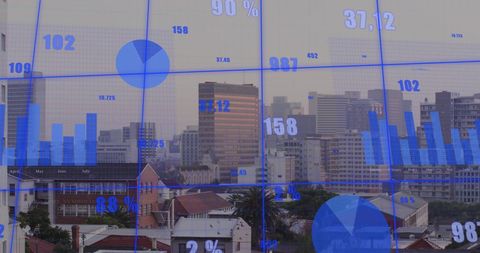
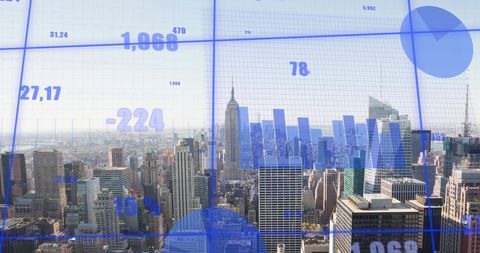
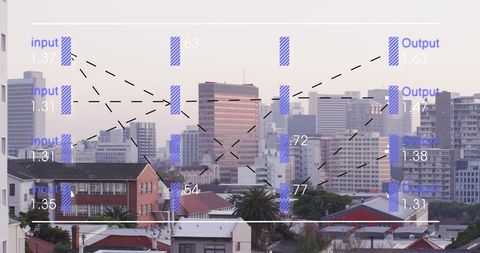
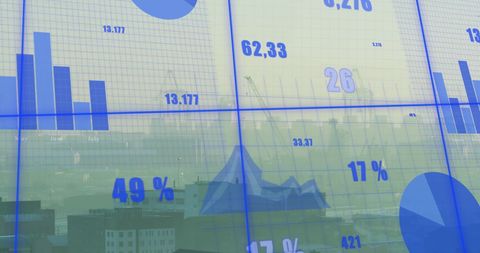
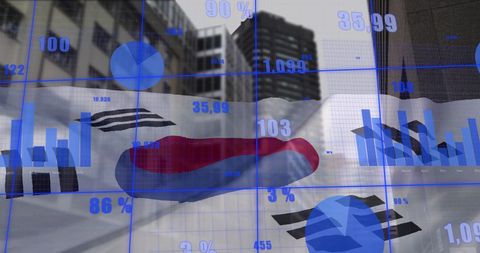
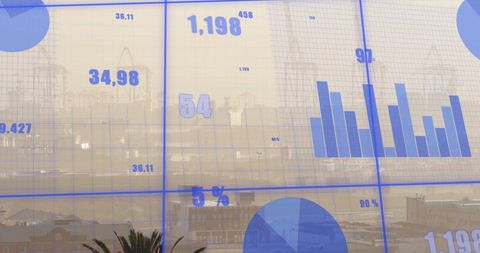
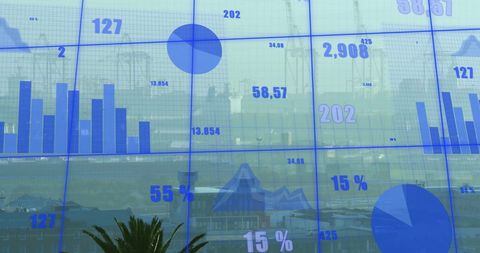
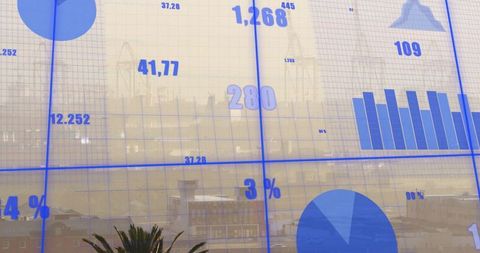
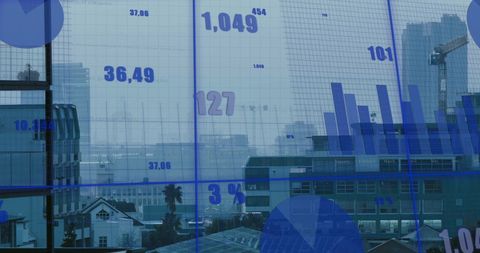
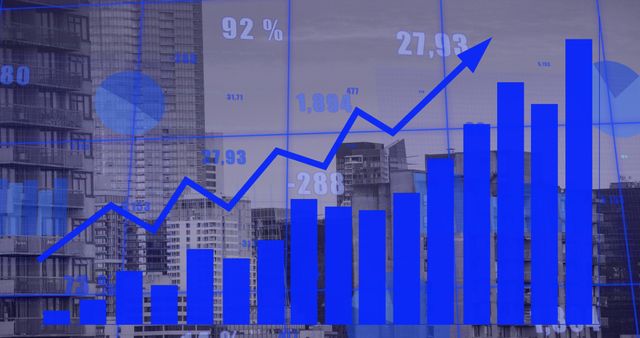
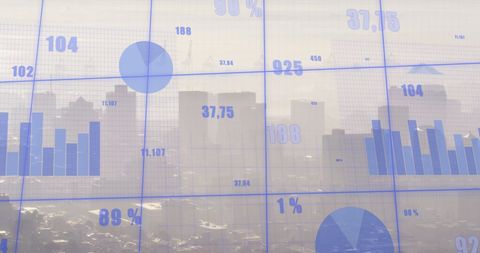
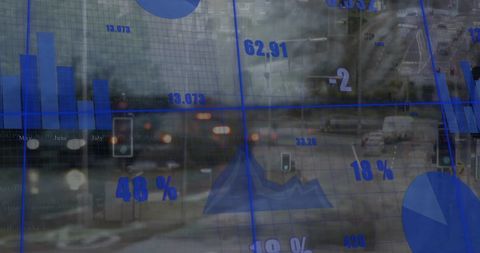
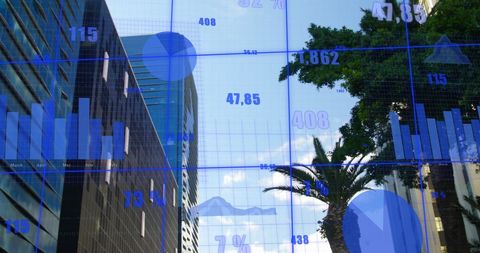
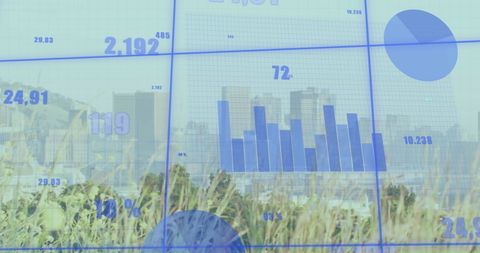
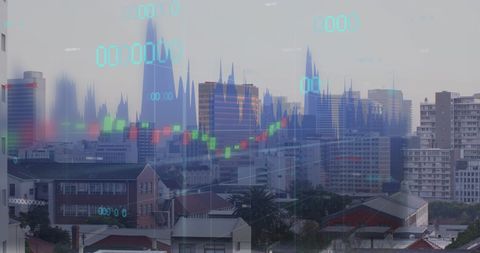
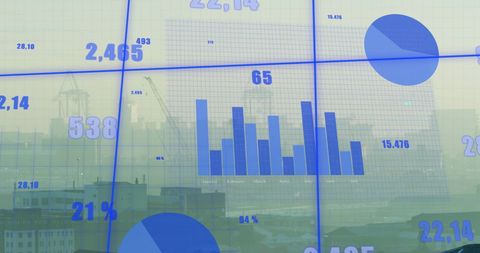
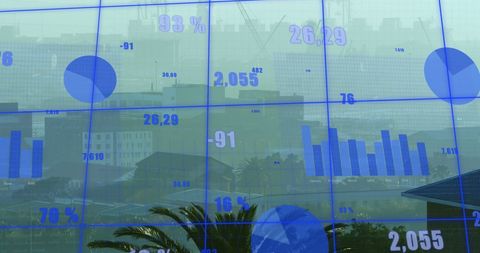
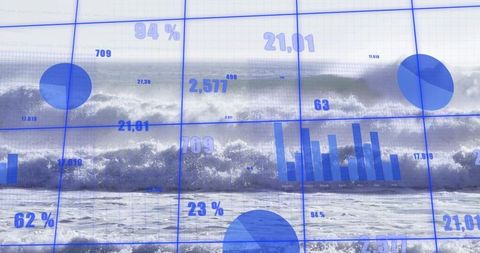
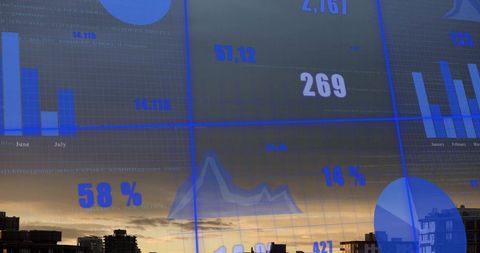
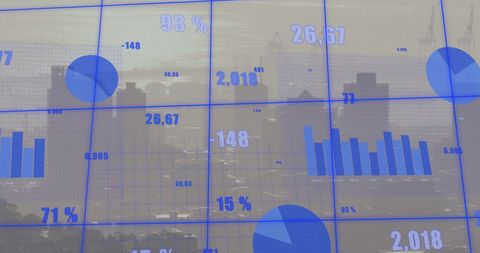
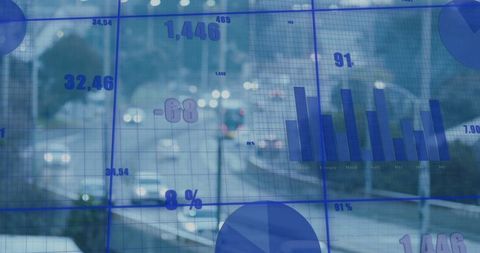
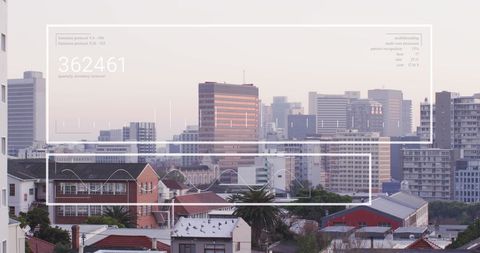
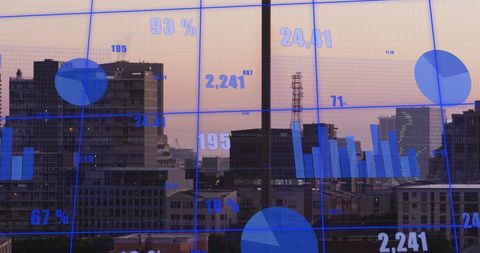
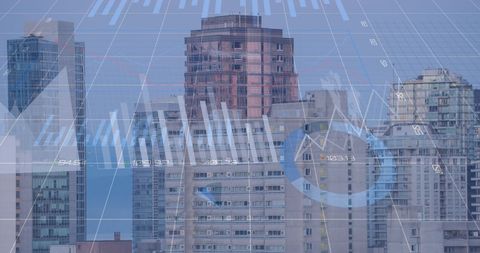
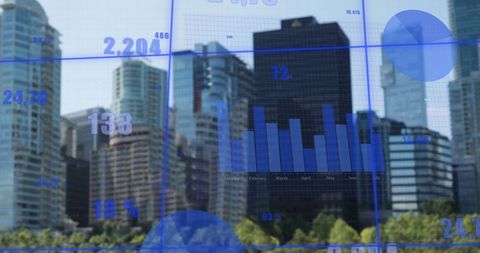
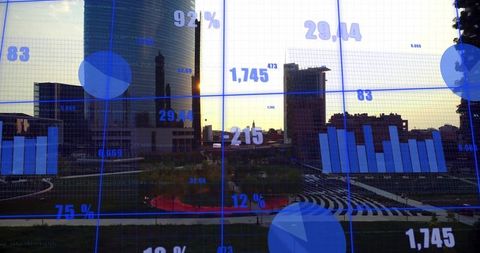
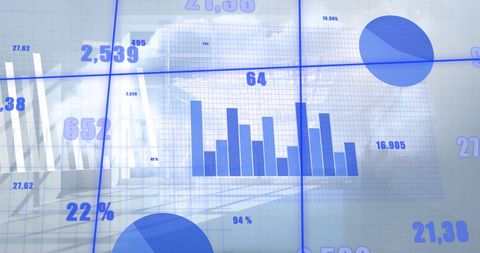
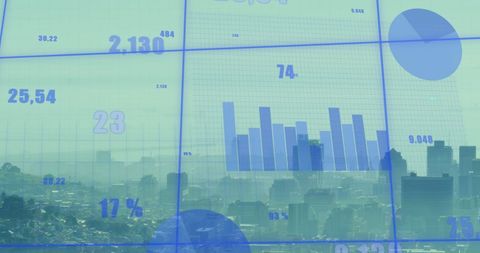
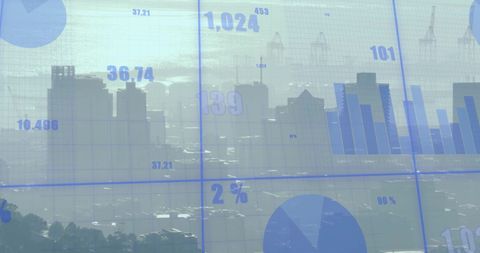
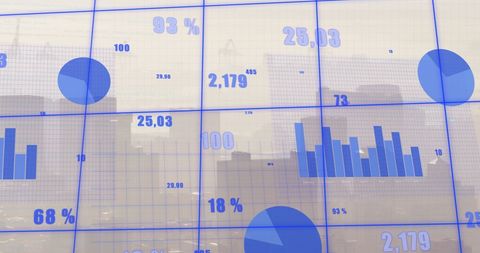
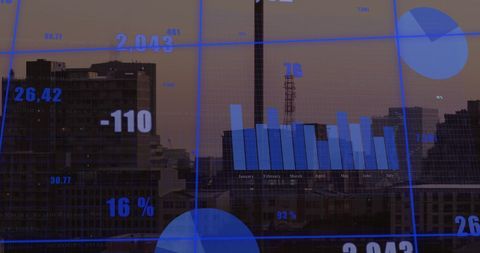
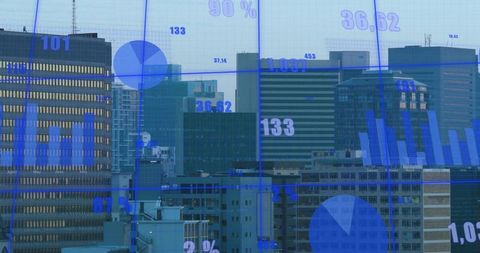
- Data Dashboards and Analytics Over Urban Skyline
Data Dashboards and Analytics Over Urban Skyline Image
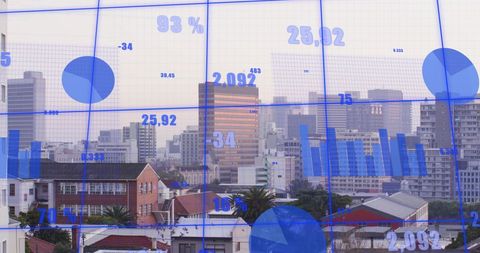
This image depicts dynamic graphs and charts superimposed over a city's skyline, symbolizing business analytics and financial growth. It serves well for illustrating concepts related to data science, economic forecasts, and urban development. Ideal for use in presentations, reports, or marketing materials about statistics, technology, and business strategies.

downloads
Tags:
More
Credit Photo
If you would like to credit the Photo, here are some ways you can do so
Text Link
photo Link
<span class="text-link">
<span>
<a target="_blank" href=https://pikwizard.com/photo/data-dashboards-and-analytics-over-urban-skyline/aba05e6cbbf25a57635a6420d3c2a7da/>PikWizard</a>
</span>
</span>
<span class="image-link">
<span
style="margin: 0 0 20px 0; display: inline-block; vertical-align: middle; width: 100%;"
>
<a
target="_blank"
href="https://pikwizard.com/photo/data-dashboards-and-analytics-over-urban-skyline/aba05e6cbbf25a57635a6420d3c2a7da/"
style="text-decoration: none; font-size: 10px; margin: 0;"
>
<img src="https://pikwizard.com/pw/medium/aba05e6cbbf25a57635a6420d3c2a7da.jpg" style="margin: 0; width: 100%;" alt="" />
<p style="font-size: 12px; margin: 0;">PikWizard</p>
</a>
</span>
</span>
Free (free of charge)
Free for personal and commercial use.
Author: Authentic Images