- Home >
- Stock Photos >
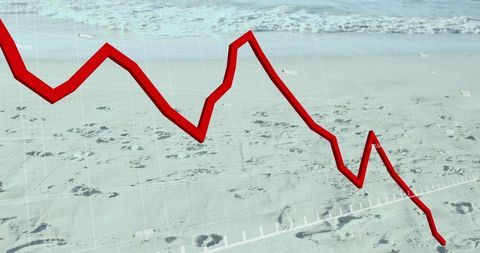
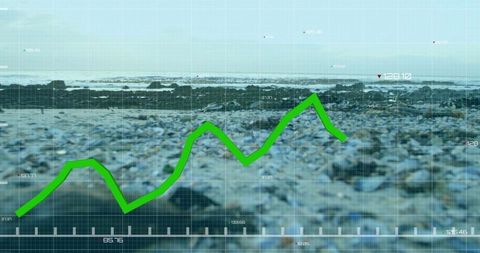
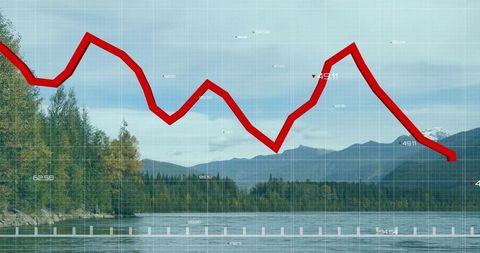
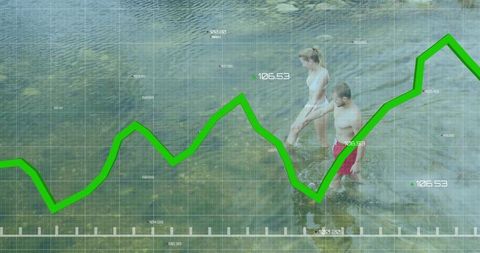
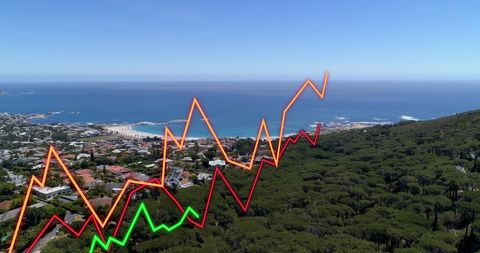
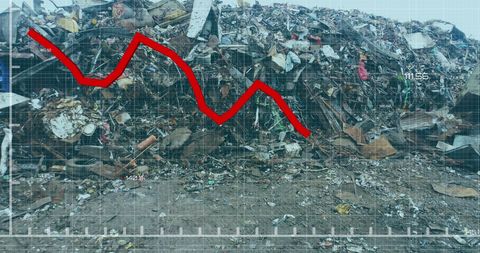
- Data Decline Concept with Graph Over Ocean
Data Decline Concept with Graph Over Ocean Image
Graphic overlay features red decline line against ocean backdrop, symbolizing downturn in data analysis or market trends. Useful for financial reports, economic trend articles, and digital interface illustrations.
Powered by  - Get 15% off with code: PIKWIZARD15


downloads
Tags:
More
Credit Photo
If you would like to credit the Photo, here are some ways you can do so
Text Link
photo Link
<span class="text-link">
<span>
<a target="_blank" href=https://pikwizard.com/photo/data-decline-concept-with-graph-over-ocean/16ada13b49782fb36492faa42b2a00cb/>PikWizard</a>
</span>
</span>
<span class="image-link">
<span
style="margin: 0 0 20px 0; display: inline-block; vertical-align: middle; width: 100%;"
>
<a
target="_blank"
href="https://pikwizard.com/photo/data-decline-concept-with-graph-over-ocean/16ada13b49782fb36492faa42b2a00cb/"
style="text-decoration: none; font-size: 10px; margin: 0;"
>
<img src="https://pikwizard.com/pw/medium/16ada13b49782fb36492faa42b2a00cb.jpg" style="margin: 0; width: 100%;" alt="" />
<p style="font-size: 12px; margin: 0;">PikWizard</p>
</a>
</span>
</span>
Free (free of charge)
Free for personal and commercial use.
Author: People Creations