
- Home >
- Stock Photos >
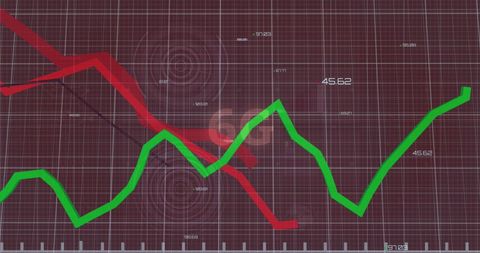
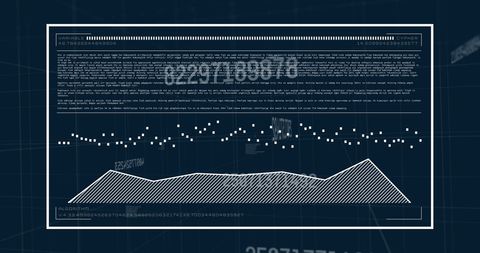
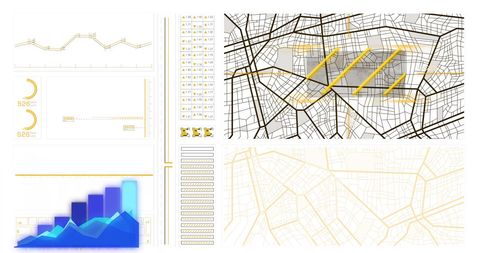
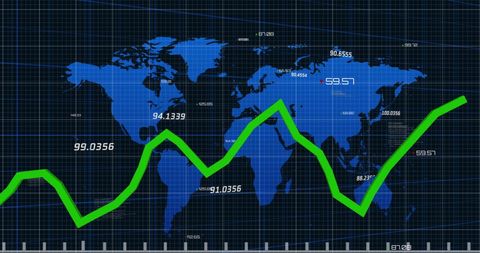
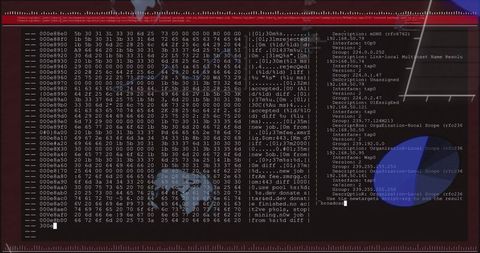
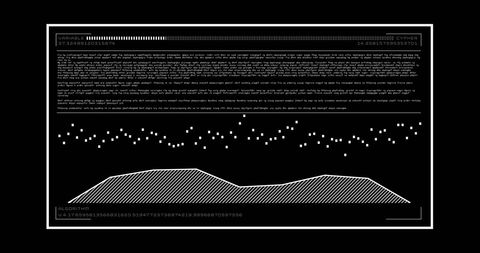
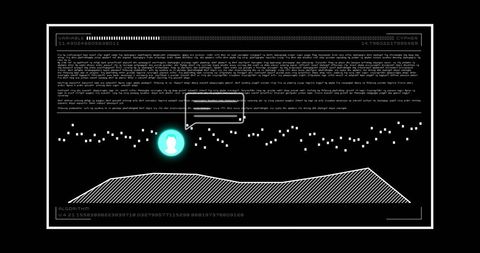
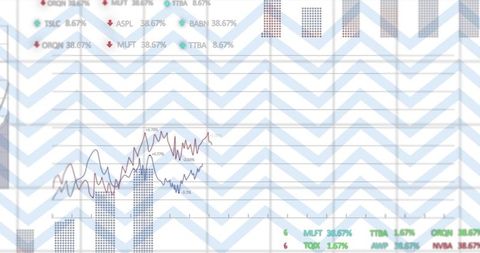
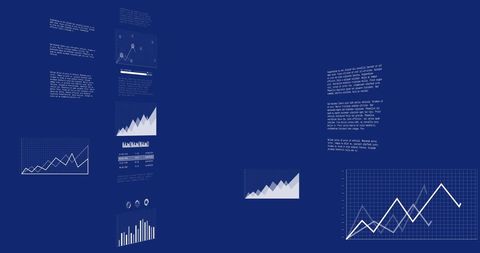
- Data Driven Financial Growth Analysis with Global Interface
Data Driven Financial Growth Analysis with Global Interface Image
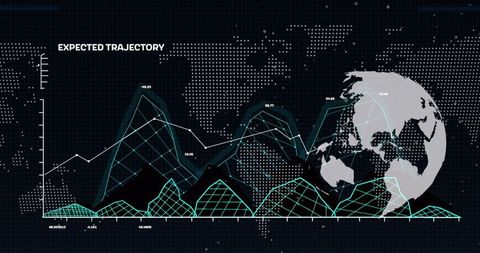
Graphic presents a futuristic interface in which financial data is analyzed with global perspectives integrated into a digital grid. Appealing to tech-savvy viewers within finance sectors, making the investment observations stand out against the visual mix of digital graphs overlaying planet Earth. Use which suits designing finance websites, presentations on global market dynamics, economic trend reviews, or teaching analytic tools in educational courses on international trade and investment. Ideal for marketing finance apps or platforms.
Powered by 


downloads
Tags:
More
Credit Photo
If you would like to credit the Photo, here are some ways you can do so
Text Link
photo Link
<span class="text-link">
<span>
<a target="_blank" href=https://pikwizard.com/photo/data-driven-financial-growth-analysis-with-global-interface/b1ef907bba79dae8e016b3a427816d6d/>PikWizard</a>
</span>
</span>
<span class="image-link">
<span
style="margin: 0 0 20px 0; display: inline-block; vertical-align: middle; width: 100%;"
>
<a
target="_blank"
href="https://pikwizard.com/photo/data-driven-financial-growth-analysis-with-global-interface/b1ef907bba79dae8e016b3a427816d6d/"
style="text-decoration: none; font-size: 10px; margin: 0;"
>
<img src="https://pikwizard.com/pw/medium/b1ef907bba79dae8e016b3a427816d6d.jpg" style="margin: 0; width: 100%;" alt="" />
<p style="font-size: 12px; margin: 0;">PikWizard</p>
</a>
</span>
</span>
Free (free of charge)
Free for personal and commercial use.
Author: Creative Art
Similar Free Stock Images
Premium


Premium


Premium


Premium


Premium


Premium


Premium


Premium

Premium


Premium


Premium


Premium

Premium

Premium


Premium


Premium


Premium

Premium


Premium


Premium

Premium

Premium


Premium


Premium


Premium


Explore More Free Stock Images