
- Home >
- Stock Photos >
- Data Flow Chart with Monitors, Buildings, and Smartphones on Grid
Data Flow Chart with Monitors, Buildings, and Smartphones on Grid Image

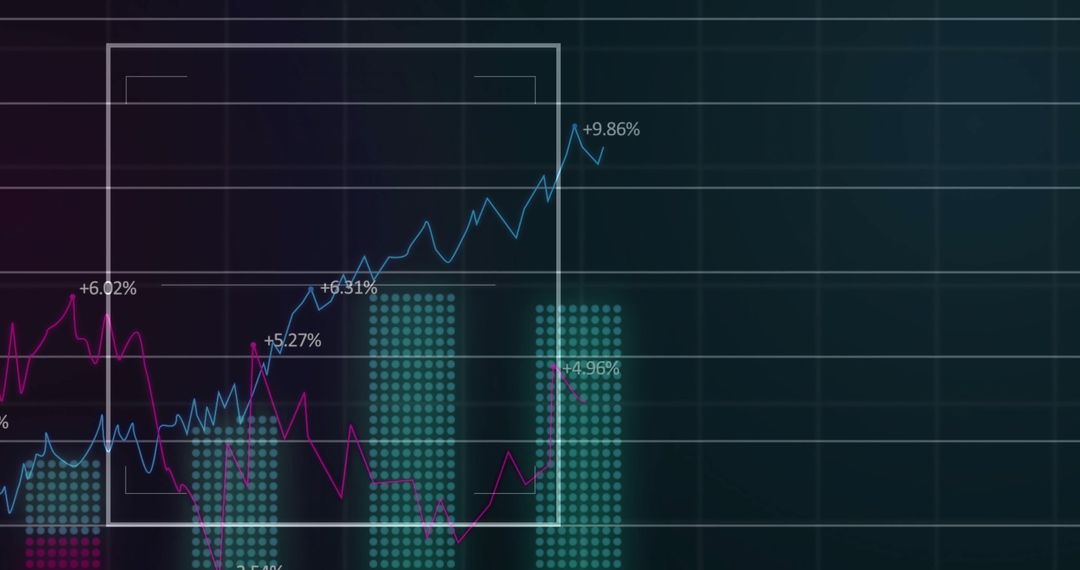
Cyan line representing data flow traverses grid, illustrating trajectory with icons of monitors, buildings, and smartphones. Useful for illustrating concepts in digital connectivity, data analytics, and technology innovations. Ideal for presentations, reports, and articles related to digital transformation and smart city solutions.
Powered by  - Get 15% off with code: PIKWIZARD15


0
downloads
downloads
Tags:
More
Credit Photo
If you would like to credit the Photo, here are some ways you can do so
Text Link
photo Link
<span class="text-link">
<span>
<a target="_blank" href=https://pikwizard.com/photo/data-flow-chart-with-monitors-buildings-and-smartphones-on-grid/8e0c751c0e945307428b083e8ef20905/>PikWizard</a>
</span>
</span>
<span class="image-link">
<span
style="margin: 0 0 20px 0; display: inline-block; vertical-align: middle; width: 100%;"
>
<a
target="_blank"
href="https://pikwizard.com/photo/data-flow-chart-with-monitors-buildings-and-smartphones-on-grid/8e0c751c0e945307428b083e8ef20905/"
style="text-decoration: none; font-size: 10px; margin: 0;"
>
<img src="https://pikwizard.com/pw/medium/8e0c751c0e945307428b083e8ef20905.jpg" style="margin: 0; width: 100%;" alt="" />
<p style="font-size: 12px; margin: 0;">PikWizard</p>
</a>
</span>
</span>
Free (free of charge)
Free for personal and commercial use.
Author: Creative Art
Similar Free Stock Images

Premium


Premium


Premium


Premium


Premium


Premium


Premium


Premium


Premium


Premium


Premium


Premium


Premium


Premium


Premium


Premium


Premium


Premium


Premium


Premium


Premium


Premium


Premium


Premium

