- Home >
- Stock Photos >
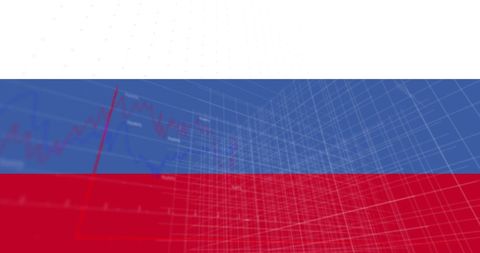
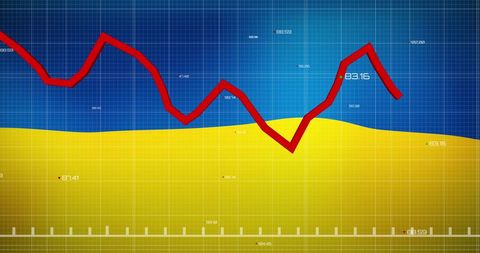
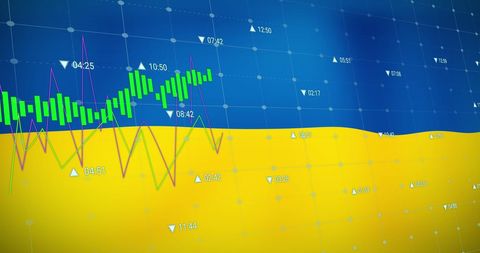
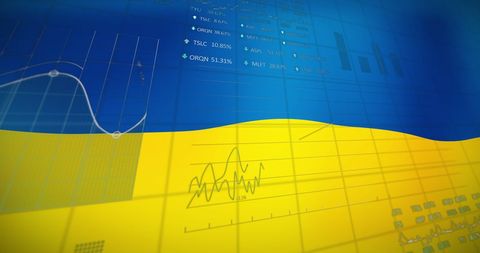
- Data Graph Joining Hands on Ukraine Flag Background
Data Graph Joining Hands on Ukraine Flag Background Image
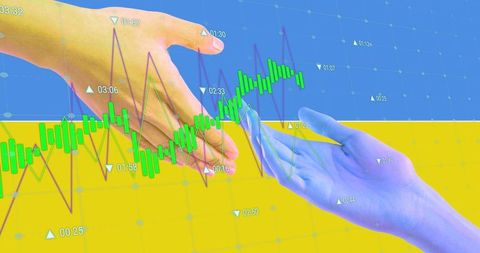
Visualizing digital transformation and connections in the context of Ukraine, this illustration features overlaying digital financial graphs on two outreached hands set against a stylized Ukraine flag theme. This conceptual depiction signifies global financial interaction, analysis, and political-economic cooperation, useful for articles on international politics, technology innovation, economic analyses amidst the Ukraine crisis, fintech solutions, finance-related presentations, data-driven collaboration aspects, and geopolitical discussions.

downloads
Tags:
More
Credit Photo
If you would like to credit the Photo, here are some ways you can do so
Text Link
photo Link
<span class="text-link">
<span>
<a target="_blank" href=https://pikwizard.com/photo/data-graph-joining-hands-on-ukraine-flag-background/06a99d2a190a11ec616fad99ba1e5c6c/>PikWizard</a>
</span>
</span>
<span class="image-link">
<span
style="margin: 0 0 20px 0; display: inline-block; vertical-align: middle; width: 100%;"
>
<a
target="_blank"
href="https://pikwizard.com/photo/data-graph-joining-hands-on-ukraine-flag-background/06a99d2a190a11ec616fad99ba1e5c6c/"
style="text-decoration: none; font-size: 10px; margin: 0;"
>
<img src="https://pikwizard.com/pw/medium/06a99d2a190a11ec616fad99ba1e5c6c.jpg" style="margin: 0; width: 100%;" alt="" />
<p style="font-size: 12px; margin: 0;">PikWizard</p>
</a>
</span>
</span>
Free (free of charge)
Free for personal and commercial use.
Author: Authentic Images