
- Home >
- Stock Photos >
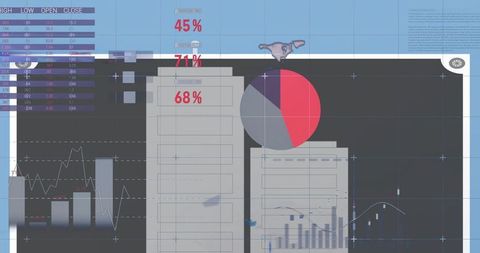
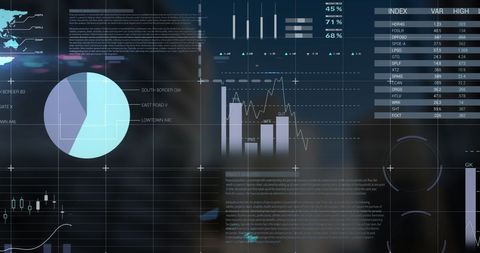
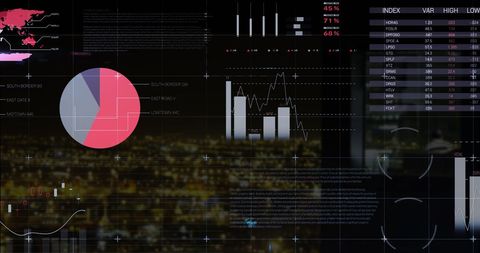
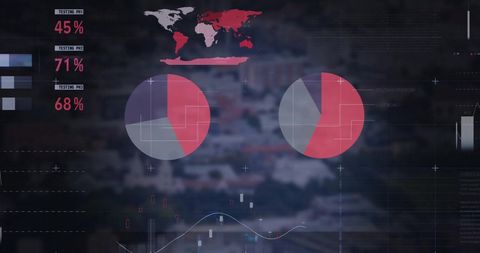
- Data Processing and Analytics Dashboard Displaying Cityscape
Data Processing and Analytics Dashboard Displaying Cityscape Image
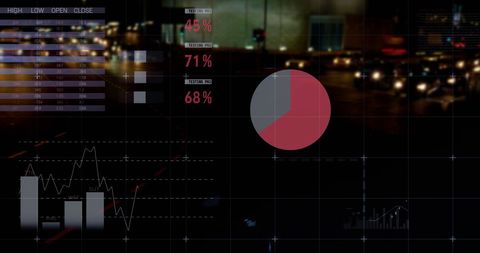
Conceptual visualization combining statistical data with a cityscape background suggests themes of connectivity and urban innovation. Useful for illustrating data-driven technologies or business intelligence. Suitable for articles or presentations about big data, modern analytics, or smart city solutions.
Powered by 


downloads
Tags:
More
Credit Photo
If you would like to credit the Photo, here are some ways you can do so
Text Link
photo Link
<span class="text-link">
<span>
<a target="_blank" href=https://pikwizard.com/photo/data-processing-and-analytics-dashboard-displaying-cityscape/779c21d2f1a28205ae82b7d2c721ad73/>PikWizard</a>
</span>
</span>
<span class="image-link">
<span
style="margin: 0 0 20px 0; display: inline-block; vertical-align: middle; width: 100%;"
>
<a
target="_blank"
href="https://pikwizard.com/photo/data-processing-and-analytics-dashboard-displaying-cityscape/779c21d2f1a28205ae82b7d2c721ad73/"
style="text-decoration: none; font-size: 10px; margin: 0;"
>
<img src="https://pikwizard.com/pw/medium/779c21d2f1a28205ae82b7d2c721ad73.jpg" style="margin: 0; width: 100%;" alt="" />
<p style="font-size: 12px; margin: 0;">PikWizard</p>
</a>
</span>
</span>
Free (free of charge)
Free for personal and commercial use.
Author: Awesome Content
Similar Free Stock Images

Premium


Premium

Premium


Premium


Premium


Premium


Premium


Premium


Premium


Premium


Premium


Premium


Premium


Premium

Premium


Premium


Premium


Premium

Premium


Premium


Premium

Premium


Premium

Premium


Premium


Explore More Free Stock Images