
- Home >
- Stock Photos >
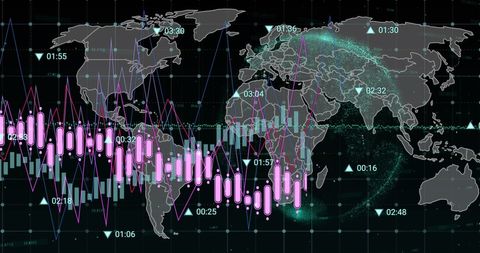
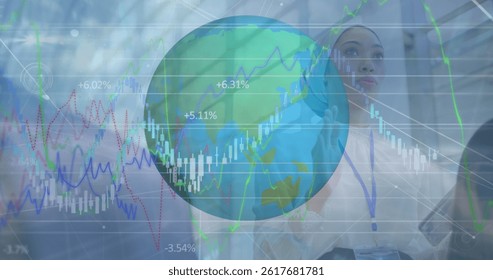
- Data Processing and Analytics on Global Finance Map
Data Processing and Analytics on Global Finance Map Image

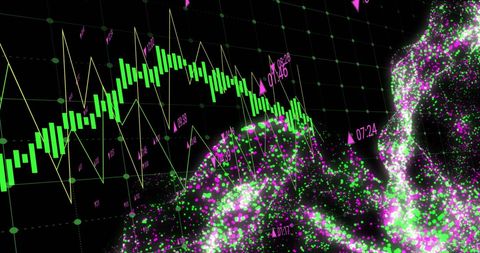
Vibrant depiction of financial data intersecting with a world map, highlighting global business and economic connections. Suitable for illustrating concepts in finance, technology, and data analytics, ideal for presentations, articles on international markets, financial reports, or educational resources on global economics.
Powered by  - Get 15% off with code: PIKWIZARD15


downloads
Tags:
More
Credit Photo
If you would like to credit the Photo, here are some ways you can do so
Text Link
photo Link
<span class="text-link">
<span>
<a target="_blank" href=https://pikwizard.com/photo/data-processing-and-analytics-on-global-finance-map/80fdb21243852a4df98e92a89980778c/>PikWizard</a>
</span>
</span>
<span class="image-link">
<span
style="margin: 0 0 20px 0; display: inline-block; vertical-align: middle; width: 100%;"
>
<a
target="_blank"
href="https://pikwizard.com/photo/data-processing-and-analytics-on-global-finance-map/80fdb21243852a4df98e92a89980778c/"
style="text-decoration: none; font-size: 10px; margin: 0;"
>
<img src="https://pikwizard.com/pw/medium/80fdb21243852a4df98e92a89980778c.jpg" style="margin: 0; width: 100%;" alt="" />
<p style="font-size: 12px; margin: 0;">PikWizard</p>
</a>
</span>
</span>
Free (free of charge)
Free for personal and commercial use.
Author: Awesome Content
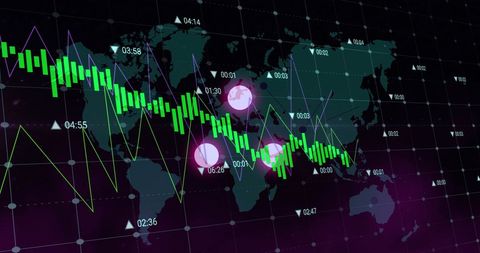
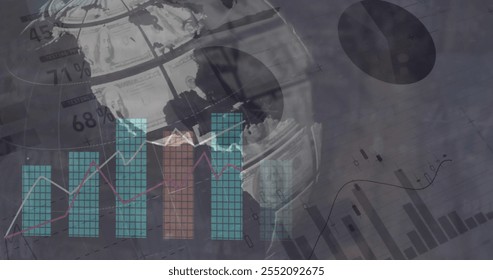
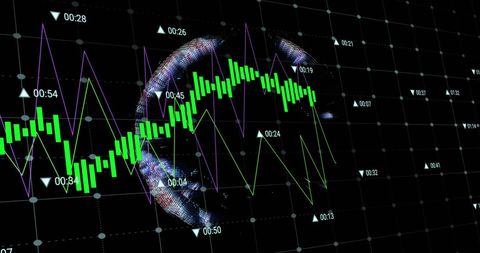
Similar Free Stock Images

Premium


Premium


Premium


Premium

Premium


Premium


Premium


Premium


Premium


Premium


Premium


Premium


Premium

Premium


Premium


Premium


Premium

Premium


Premium


Premium


Premium


Premium


Premium


Premium


Premium


Explore More Free Stock Images