
- Home >
- Free Stock Photos & Images >
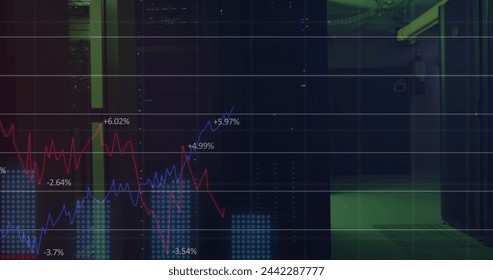
- Data Processing and Cloud Computing Server Room Visualization
Data Processing and Cloud Computing Server Room Visualization Free Stock Image

Visualization of statistical data overlaying a computer server room represents concepts of data processing, cloud computing, and technology. Useful for presentations or articles related to advancements in ICT, data management, and financial analysis in corporate environments.
Powered by  - Get 15% off with code: PIKWIZARD15


downloads
Tags:
More
Credit Photo
If you would like to credit the Photo, here are some ways you can do so
Text Link
photo Link
<span class="text-link">
<span>
<a target="_blank" href=https://pikwizard.com/photo/data-processing-and-cloud-computing-server-room-visualization/f6add8198fe92c9b900bb62ba7f5fd00/>PikWizard</a>
</span>
</span>
<span class="image-link">
<span
style="margin: 0 0 20px 0; display: inline-block; vertical-align: middle; width: 100%;"
>
<a
target="_blank"
href="https://pikwizard.com/photo/data-processing-and-cloud-computing-server-room-visualization/f6add8198fe92c9b900bb62ba7f5fd00/"
style="text-decoration: none; font-size: 10px; margin: 0;"
>
<img src="https://thumbs.wbm.im/pw/medium/f6add8198fe92c9b900bb62ba7f5fd00.jpg" style="margin: 0; width: 100%;" alt="Data Processing and Cloud Computing Server Room Visualization" />
<p style="font-size: 12px; margin: 0;">PikWizard</p>
</a>
</span>
</span>
Free (free of charge)
Free for personal and commercial use.
Author: Creative Art
Similar Free Stock Images


Premium


Premium


Premium


Premium


Premium


Premium


Premium


Premium


Premium


Premium


Premium


Premium


Premium


Premium


Premium


Premium


Premium


Premium


Premium


Premium


Premium


Premium


Premium


Premium


Premium

Explore More Free Stock Images