- Home >
- Stock Photos >
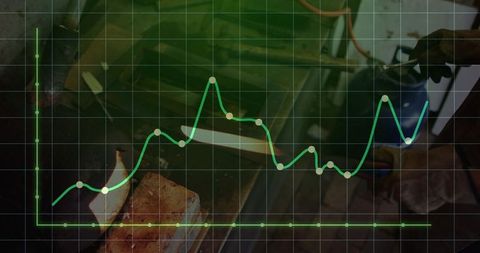
- Data Processing and Graph Analysis in Tech Environment
Data Processing and Graph Analysis in Tech Environment Image
Illustrates data processing and analysis represented by graphs over digital code in a technological environment. Ideal for use in articles or presentations about tech trends, financial data analytics, global communication, or digital technology solutions.

downloads
Tags:
More
Credit Photo
If you would like to credit the Photo, here are some ways you can do so
Text Link
photo Link
<span class="text-link">
<span>
<a target="_blank" href=https://pikwizard.com/photo/data-processing-and-graph-analysis-in-tech-environment/2689d2e2389e95dda8c0d6f974c363b7/>PikWizard</a>
</span>
</span>
<span class="image-link">
<span
style="margin: 0 0 20px 0; display: inline-block; vertical-align: middle; width: 100%;"
>
<a
target="_blank"
href="https://pikwizard.com/photo/data-processing-and-graph-analysis-in-tech-environment/2689d2e2389e95dda8c0d6f974c363b7/"
style="text-decoration: none; font-size: 10px; margin: 0;"
>
<img src="https://pikwizard.com/pw/medium/2689d2e2389e95dda8c0d6f974c363b7.jpg" style="margin: 0; width: 100%;" alt="" />
<p style="font-size: 12px; margin: 0;">PikWizard</p>
</a>
</span>
</span>
Free (free of charge)
Free for personal and commercial use.
Author: Awesome Content