- Home >
- Stock Photos >
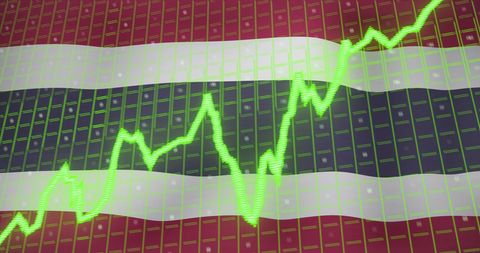
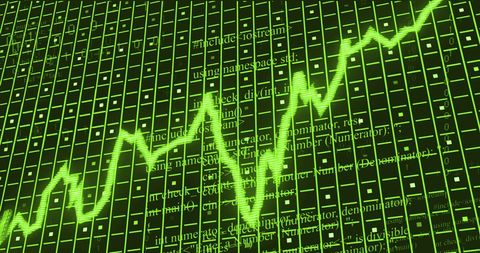
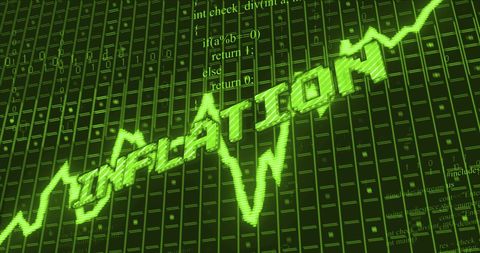
- Data Processing and Stagflation Concept with NATO Emblem
Data Processing and Stagflation Concept with NATO Emblem Image

This visual represents the intersection of global financial trends, economic challenges like stagflation, and the presence of NATO's influence. The digital graph and stagflation text overlaid with the NATO emblem suggest themes of international economic policy, financial stability, and geopolitical dynamics. Useful for articles or presentations related to economics, global financial markets, international Relations and military alliances shaping economies.

downloads
Tags:
More
Credit Photo
If you would like to credit the Photo, here are some ways you can do so
Text Link
photo Link
<span class="text-link">
<span>
<a target="_blank" href=https://pikwizard.com/photo/data-processing-and-stagflation-concept-with-nato-emblem/b5db94ccaecc553f3fbe8579b7fd4163/>PikWizard</a>
</span>
</span>
<span class="image-link">
<span
style="margin: 0 0 20px 0; display: inline-block; vertical-align: middle; width: 100%;"
>
<a
target="_blank"
href="https://pikwizard.com/photo/data-processing-and-stagflation-concept-with-nato-emblem/b5db94ccaecc553f3fbe8579b7fd4163/"
style="text-decoration: none; font-size: 10px; margin: 0;"
>
<img src="https://pikwizard.com/pw/medium/b5db94ccaecc553f3fbe8579b7fd4163.jpg" style="margin: 0; width: 100%;" alt="" />
<p style="font-size: 12px; margin: 0;">PikWizard</p>
</a>
</span>
</span>
Free (free of charge)
Free for personal and commercial use.
Author: People Creations