- Home >
- Stock Photos >
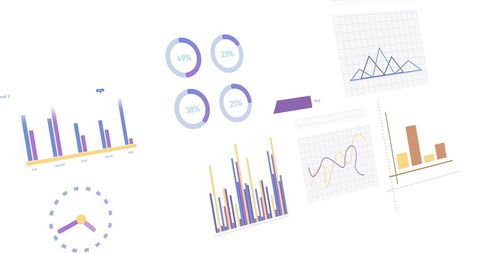
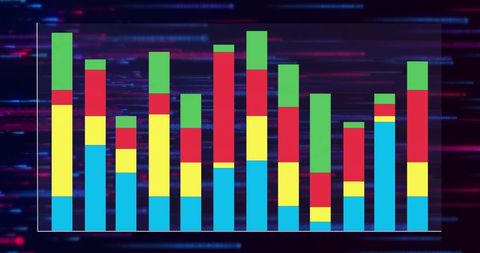
- Data Processing Graph with Digital Interface Elements
Data Processing Graph with Digital Interface Elements Image

The image shows a graph comparing data points across different categories, labeled as first, second, third, fourth, and fifth. It features digital interface elements for adjusting data views and analyzing statistics, which could aid presentations or reports in business and marketing fields, demonstrating data interpretation or trends analysis.

downloads
Tags:
More
Credit Photo
If you would like to credit the Photo, here are some ways you can do so
Text Link
photo Link
<span class="text-link">
<span>
<a target="_blank" href=https://pikwizard.com/photo/data-processing-graph-with-digital-interface-elements/ef35ab7e4677a70d58d6695cdcf82118/>PikWizard</a>
</span>
</span>
<span class="image-link">
<span
style="margin: 0 0 20px 0; display: inline-block; vertical-align: middle; width: 100%;"
>
<a
target="_blank"
href="https://pikwizard.com/photo/data-processing-graph-with-digital-interface-elements/ef35ab7e4677a70d58d6695cdcf82118/"
style="text-decoration: none; font-size: 10px; margin: 0;"
>
<img src="https://pikwizard.com/pw/medium/ef35ab7e4677a70d58d6695cdcf82118.jpg" style="margin: 0; width: 100%;" alt="" />
<p style="font-size: 12px; margin: 0;">PikWizard</p>
</a>
</span>
</span>
Free (free of charge)
Free for personal and commercial use.
Author: People Creations