
- Home >
- Stock Photos >
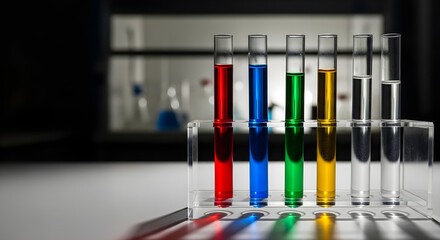
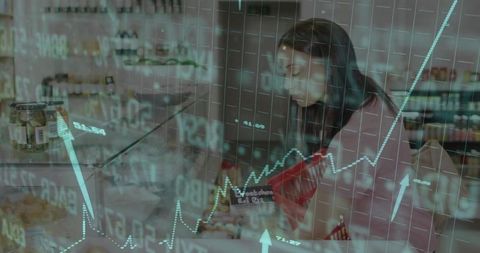
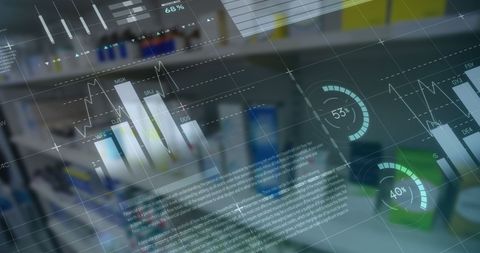
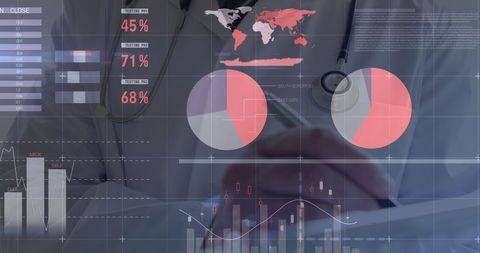
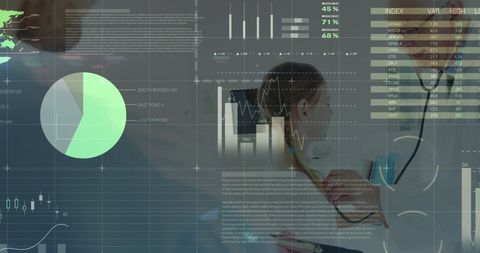
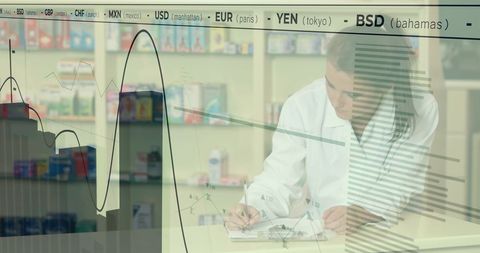
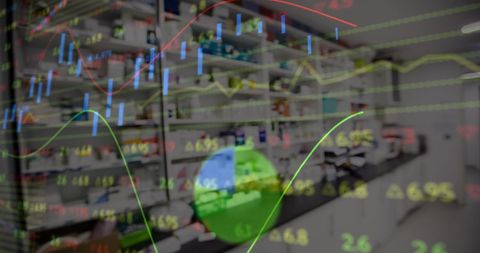
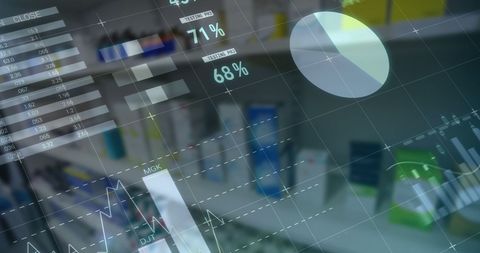
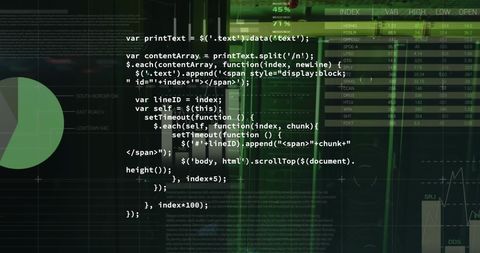
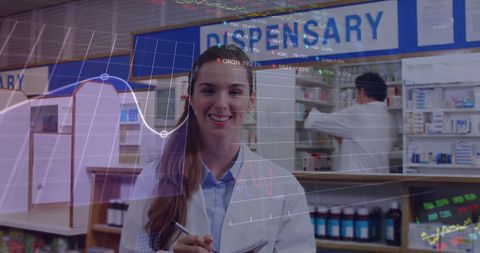
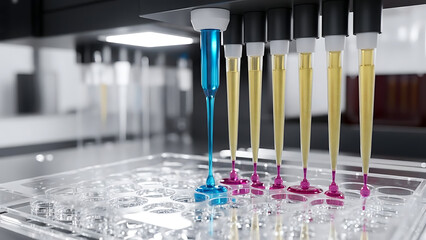
- Data Processing in Pharmacy Environment with Charts and Graphs
Data Processing in Pharmacy Environment with Charts and Graphs Image
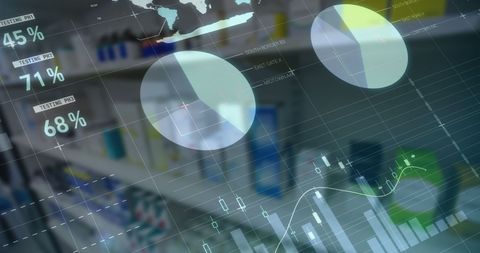
Abstract concept combines pharmaceutical environment with digital data visualization. Pie charts and graphical lines represent data analysis in healthcare. Ideal for use in presentations on pharmaceutical industry trends, healthcare data analytics, and digital technology integration in healthcare management.
Powered by 


downloads
Tags:
More
Credit Photo
If you would like to credit the Photo, here are some ways you can do so
Text Link
photo Link
<span class="text-link">
<span>
<a target="_blank" href=https://pikwizard.com/photo/data-processing-in-pharmacy-environment-with-charts-and-graphs/8b8a8e686f58f1409003641d25a502b7/>PikWizard</a>
</span>
</span>
<span class="image-link">
<span
style="margin: 0 0 20px 0; display: inline-block; vertical-align: middle; width: 100%;"
>
<a
target="_blank"
href="https://pikwizard.com/photo/data-processing-in-pharmacy-environment-with-charts-and-graphs/8b8a8e686f58f1409003641d25a502b7/"
style="text-decoration: none; font-size: 10px; margin: 0;"
>
<img src="https://pikwizard.com/pw/medium/8b8a8e686f58f1409003641d25a502b7.jpg" style="margin: 0; width: 100%;" alt="" />
<p style="font-size: 12px; margin: 0;">PikWizard</p>
</a>
</span>
</span>
Free (free of charge)
Free for personal and commercial use.
Author: Awesome Content
Similar Free Stock Images

Premium


Premium


Premium


Premium


Premium


Premium


Premium


Premium


Premium


Premium


Premium


Premium


Premium

Premium


Premium


Premium


Premium


Premium


Premium

Premium


Premium


Premium


Premium


Premium


Premium
Explore More Free Stock Images