- Home >
- Stock Photos >
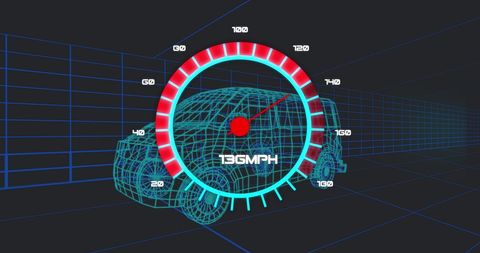
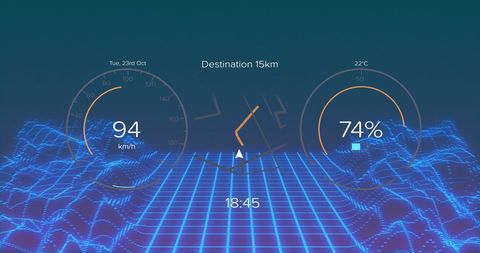
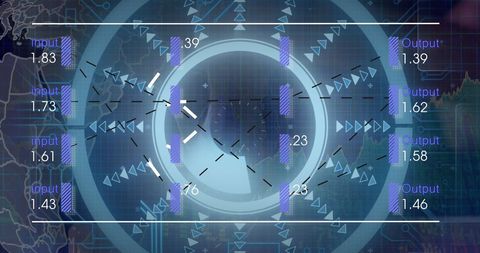
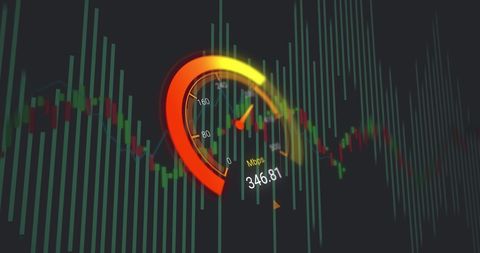
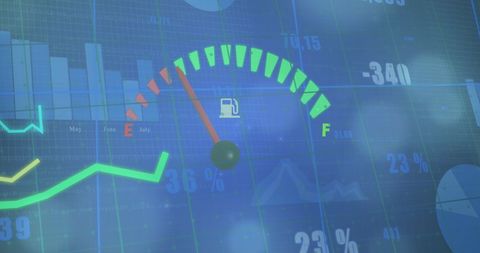
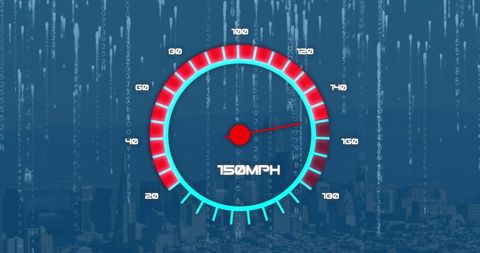
- Data Processing Interface Displaying Speedometer and Graph
Data Processing Interface Displaying Speedometer and Graph Image
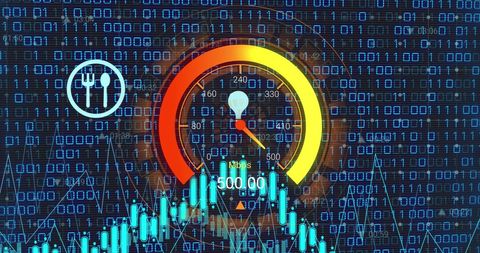
Futuristic visualization merges digital speedometer with binary code in background, suggesting quick data processing and technology efficiency. Useful for business presentations, digital marketing, financial analysis tools, and technology web banners highlighting advanced data capabilities and performance monitoring.

downloads
Tags:
More
Credit Photo
If you would like to credit the Photo, here are some ways you can do so
Text Link
photo Link
<span class="text-link">
<span>
<a target="_blank" href=https://pikwizard.com/photo/data-processing-interface-displaying-speedometer-and-graph/4ce410028fc899b58f7fd8896355feeb/>PikWizard</a>
</span>
</span>
<span class="image-link">
<span
style="margin: 0 0 20px 0; display: inline-block; vertical-align: middle; width: 100%;"
>
<a
target="_blank"
href="https://pikwizard.com/photo/data-processing-interface-displaying-speedometer-and-graph/4ce410028fc899b58f7fd8896355feeb/"
style="text-decoration: none; font-size: 10px; margin: 0;"
>
<img src="https://pikwizard.com/pw/medium/4ce410028fc899b58f7fd8896355feeb.jpg" style="margin: 0; width: 100%;" alt="" />
<p style="font-size: 12px; margin: 0;">PikWizard</p>
</a>
</span>
</span>
Free (free of charge)
Free for personal and commercial use.
Author: People Creations