- Home >
- Stock Photos >
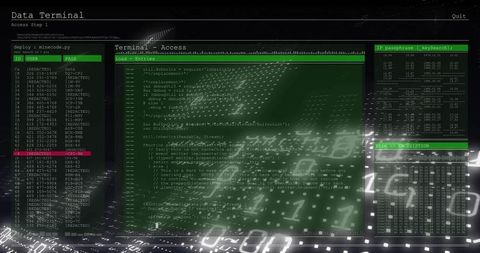
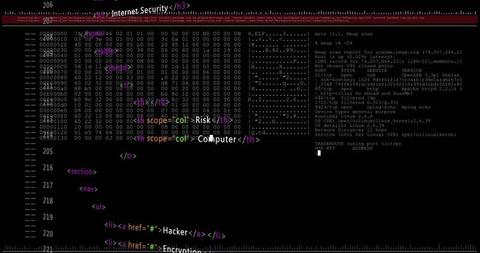
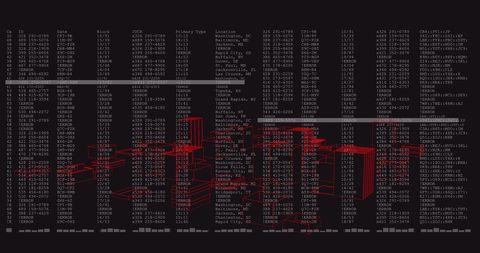
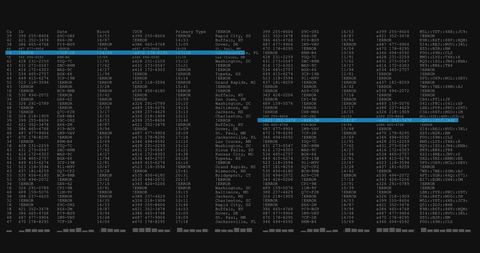
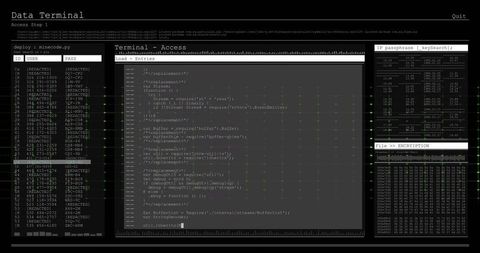
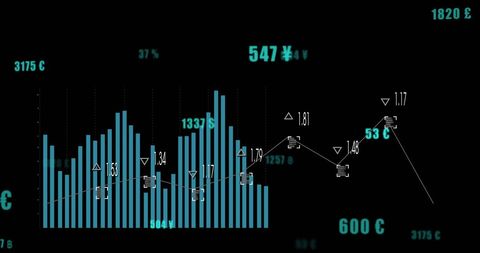
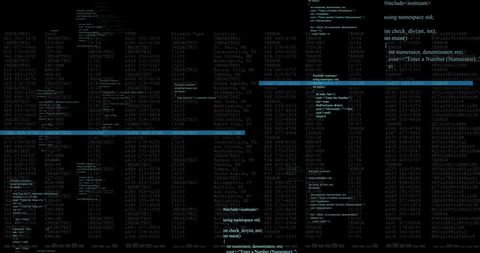
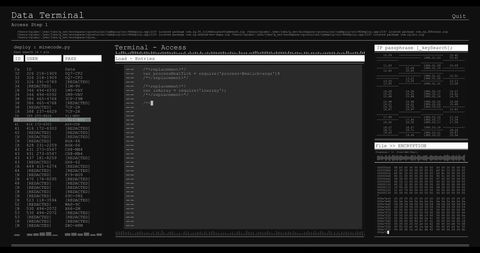
- Data Processing Interface with Graph Overlay on Black Background
Data Processing Interface with Graph Overlay on Black Background Image

This visual of a digital interface showcases a white graph overlayed on a black background filled with data processing details and binary code. Ideal for use in IT presentations, cyber security training, software development materials, and articles related to data analysis and network communications.

downloads
Tags:
More
Credit Photo
If you would like to credit the Photo, here are some ways you can do so
Text Link
photo Link
<span class="text-link">
<span>
<a target="_blank" href=https://pikwizard.com/photo/data-processing-interface-with-graph-overlay-on-black-background/279da735507651c18eea599ba367a7cc/>PikWizard</a>
</span>
</span>
<span class="image-link">
<span
style="margin: 0 0 20px 0; display: inline-block; vertical-align: middle; width: 100%;"
>
<a
target="_blank"
href="https://pikwizard.com/photo/data-processing-interface-with-graph-overlay-on-black-background/279da735507651c18eea599ba367a7cc/"
style="text-decoration: none; font-size: 10px; margin: 0;"
>
<img src="https://pikwizard.com/pw/medium/279da735507651c18eea599ba367a7cc.jpg" style="margin: 0; width: 100%;" alt="" />
<p style="font-size: 12px; margin: 0;">PikWizard</p>
</a>
</span>
</span>
Free (free of charge)
Free for personal and commercial use.
Author: Creative Art