- Home >
- Stock Photos >
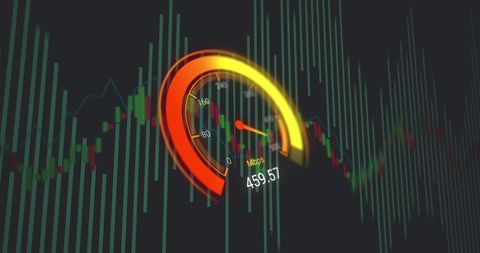
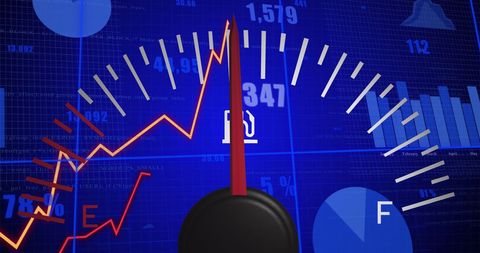
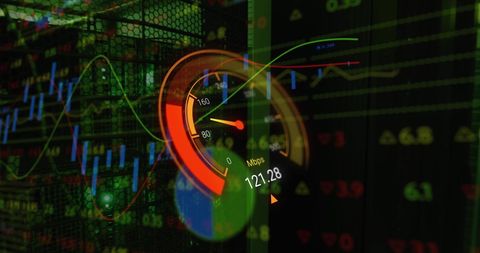
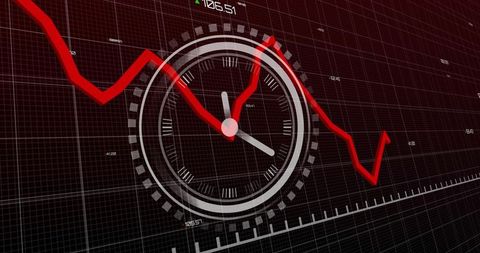
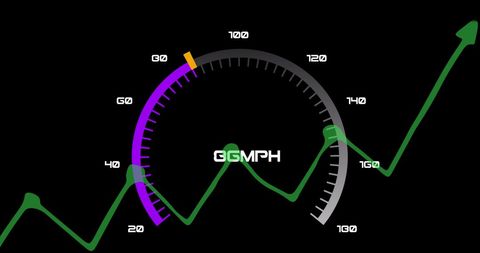
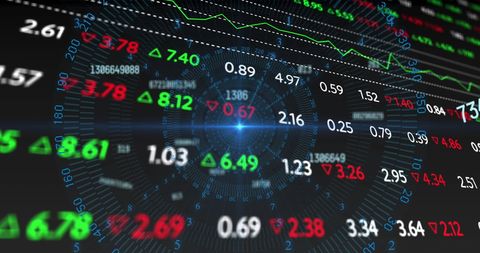
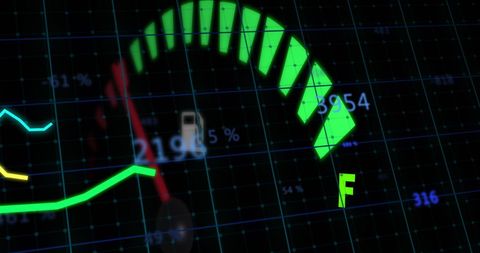
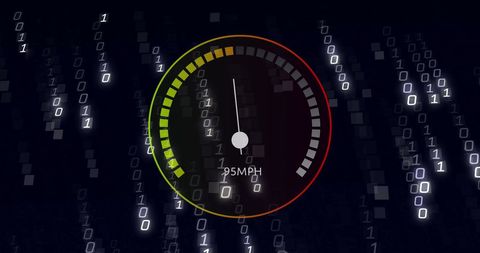
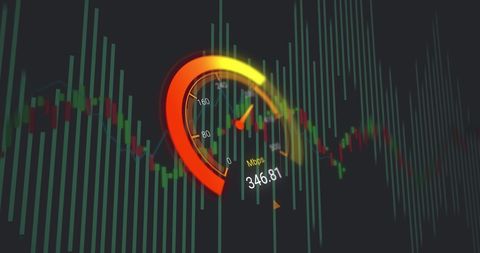
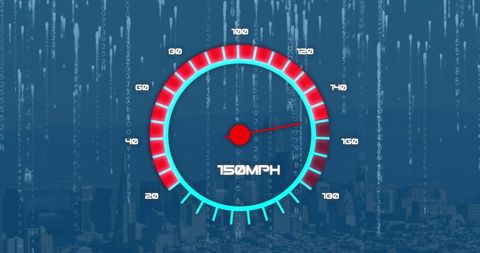
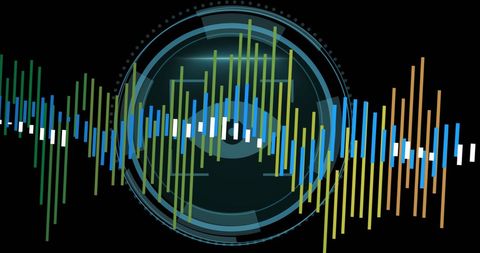
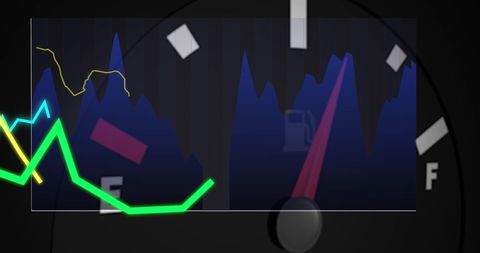
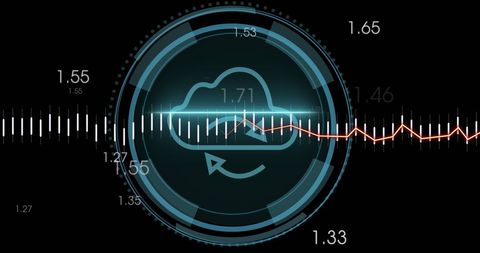
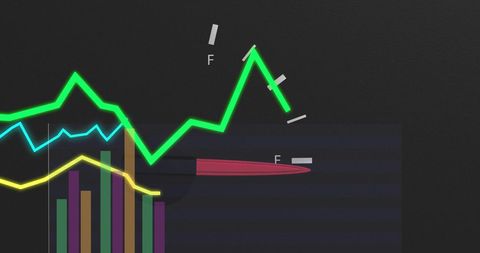
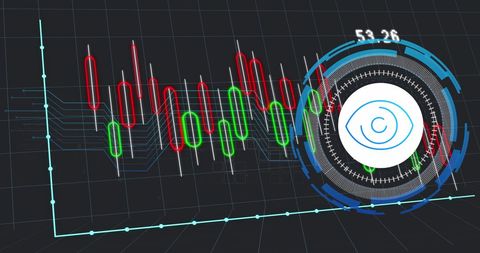
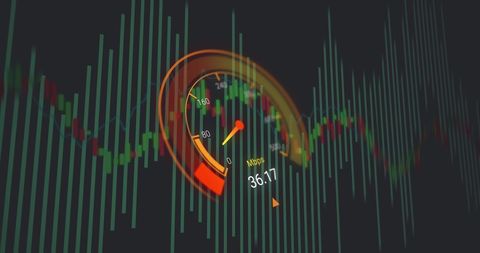
- Data Processing On Speedometer With Digital Graph Overlay
Data Processing On Speedometer With Digital Graph Overlay Image
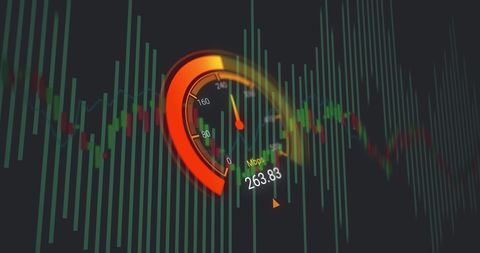
Dynamic representation of data processing blending with a speedometer and digital graph overlay. Illustrates concepts of high-speed data processing, performance measurement, and technological advancements. Ideal for use in presentations, publications, or articles focusing on technology, data analysis, and digital transformation.

downloads
Tags:
More
Credit Photo
If you would like to credit the Photo, here are some ways you can do so
Text Link
photo Link
<span class="text-link">
<span>
<a target="_blank" href=https://pikwizard.com/photo/data-processing-on-speedometer-with-digital-graph-overlay/9c7cb4ee6c4e5bc78d326556c8cd9c22/>PikWizard</a>
</span>
</span>
<span class="image-link">
<span
style="margin: 0 0 20px 0; display: inline-block; vertical-align: middle; width: 100%;"
>
<a
target="_blank"
href="https://pikwizard.com/photo/data-processing-on-speedometer-with-digital-graph-overlay/9c7cb4ee6c4e5bc78d326556c8cd9c22/"
style="text-decoration: none; font-size: 10px; margin: 0;"
>
<img src="https://pikwizard.com/pw/medium/9c7cb4ee6c4e5bc78d326556c8cd9c22.jpg" style="margin: 0; width: 100%;" alt="" />
<p style="font-size: 12px; margin: 0;">PikWizard</p>
</a>
</span>
</span>
Free (free of charge)
Free for personal and commercial use.
Author: Creative Art