- Home >
- Stock Photos >
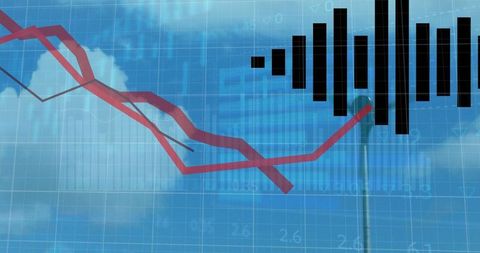
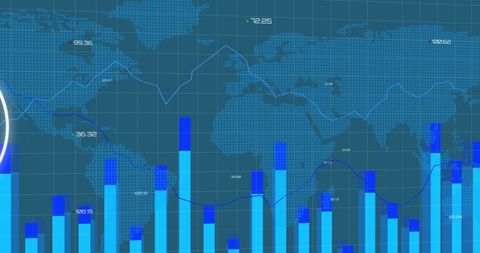
- Data Processing Overlaid on Dynamic Global Map with Graphs
Data Processing Overlaid on Dynamic Global Map with Graphs Image

Visual representation of data processing featuring graph overlays on a dark, gridded global map. Includes charts illustrating a downward trend, implying stock market changes or financial instability. Ideal for commerce, economics studies, business financial risk analysis presentations, or editorial content discussing global market shifts.

downloads
Tags:
More
Credit Photo
If you would like to credit the Photo, here are some ways you can do so
Text Link
photo Link
<span class="text-link">
<span>
<a target="_blank" href=https://pikwizard.com/photo/data-processing-overlaid-on-dynamic-global-map-with-graphs/aa20c063f0618412e26faaafa40d19ff/>PikWizard</a>
</span>
</span>
<span class="image-link">
<span
style="margin: 0 0 20px 0; display: inline-block; vertical-align: middle; width: 100%;"
>
<a
target="_blank"
href="https://pikwizard.com/photo/data-processing-overlaid-on-dynamic-global-map-with-graphs/aa20c063f0618412e26faaafa40d19ff/"
style="text-decoration: none; font-size: 10px; margin: 0;"
>
<img src="https://pikwizard.com/pw/medium/aa20c063f0618412e26faaafa40d19ff.jpg" style="margin: 0; width: 100%;" alt="" />
<p style="font-size: 12px; margin: 0;">PikWizard</p>
</a>
</span>
</span>
Free (free of charge)
Free for personal and commercial use.
Author: Awesome Content