
- Home >
- Stock Photos >
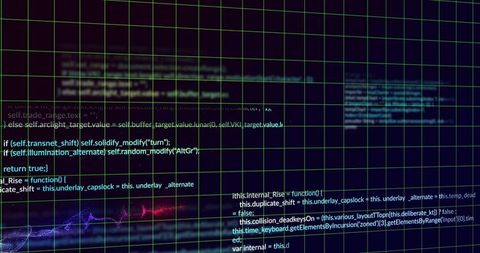
- Data Processing Overlaid on Graphs and Code in Digital Interface
Data Processing Overlaid on Graphs and Code in Digital Interface Image

Colorful digital background showcasing overlay of coding and statistical graphs symbolizes the synergy between technology and business analytics. Useful for illustrating technological advancements, economic analyses, financial forecasting, and educational materials on computer programming and data science.
Powered by  - Get 15% off with code: PIKWIZARD15


downloads
Tags:
More
Credit Photo
If you would like to credit the Photo, here are some ways you can do so
Text Link
photo Link
<span class="text-link">
<span>
<a target="_blank" href=https://pikwizard.com/photo/data-processing-overlaid-on-graphs-and-code-in-digital-interface/46a6361086586cb8dfb11cdf85894b28/>PikWizard</a>
</span>
</span>
<span class="image-link">
<span
style="margin: 0 0 20px 0; display: inline-block; vertical-align: middle; width: 100%;"
>
<a
target="_blank"
href="https://pikwizard.com/photo/data-processing-overlaid-on-graphs-and-code-in-digital-interface/46a6361086586cb8dfb11cdf85894b28/"
style="text-decoration: none; font-size: 10px; margin: 0;"
>
<img src="https://pikwizard.com/pw/medium/46a6361086586cb8dfb11cdf85894b28.jpg" style="margin: 0; width: 100%;" alt="" />
<p style="font-size: 12px; margin: 0;">PikWizard</p>
</a>
</span>
</span>
Free (free of charge)
Free for personal and commercial use.
Author: Authentic Images
Similar Free Stock Images

Premium


Premium


Premium


Premium


Premium

Premium


Premium

Premium


Premium


Premium


Premium


Premium


Premium


Premium


Premium

Premium


Premium


Premium


Premium

Premium


Premium


Premium


Premium


Premium


Premium


Explore More Free Stock Images