
- Home >
- Stock Photos >
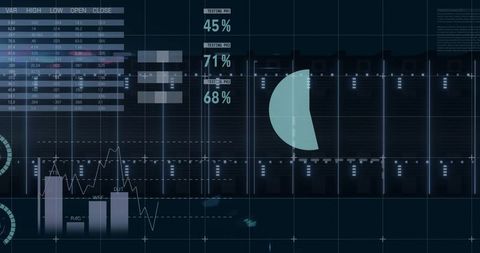
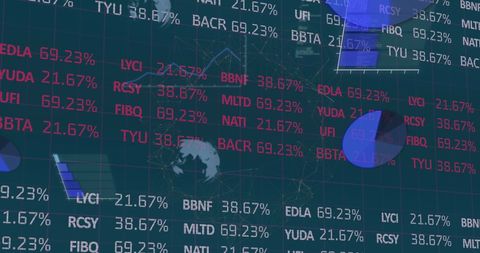
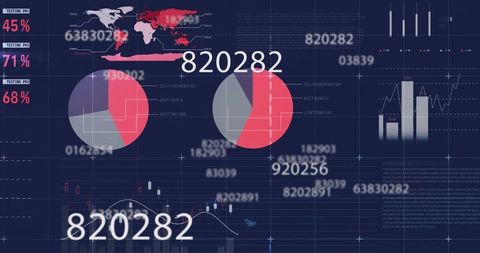
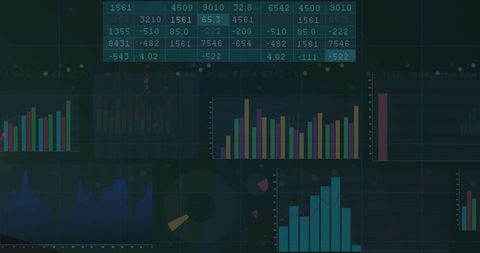
- Data Processing Overlay on Digital Charts and Graphs
Data Processing Overlay on Digital Charts and Graphs Image
Ideal for illustrating concepts related to digital data analysis, financial assessments, technological communication, or network connectivity in business environments. This visual can accompany content in finance, analytics, computations, and technology-focused presentations or marketing materials.
Powered by 


downloads
Tags:
More
Credit Photo
If you would like to credit the Photo, here are some ways you can do so
Text Link
photo Link
<span class="text-link">
<span>
<a target="_blank" href=https://pikwizard.com/photo/data-processing-overlay-on-digital-charts-and-graphs/59a2e621b21c0ab175ca0c30ec4f1dbd/>PikWizard</a>
</span>
</span>
<span class="image-link">
<span
style="margin: 0 0 20px 0; display: inline-block; vertical-align: middle; width: 100%;"
>
<a
target="_blank"
href="https://pikwizard.com/photo/data-processing-overlay-on-digital-charts-and-graphs/59a2e621b21c0ab175ca0c30ec4f1dbd/"
style="text-decoration: none; font-size: 10px; margin: 0;"
>
<img src="https://pikwizard.com/pw/medium/59a2e621b21c0ab175ca0c30ec4f1dbd.jpg" style="margin: 0; width: 100%;" alt="" />
<p style="font-size: 12px; margin: 0;">PikWizard</p>
</a>
</span>
</span>
Free (free of charge)
Free for personal and commercial use.
Author: Awesome Content
Similar Free Stock Images

Premium


Premium


Premium


Premium


Premium


Premium


Premium


Premium

Premium

Premium


Premium


Premium


Premium


Premium

Premium


Premium


Premium

Premium


Premium


Premium


Premium


Premium


Premium


Premium


Premium

Explore More Free Stock Images