
- Home >
- Stock Photos >
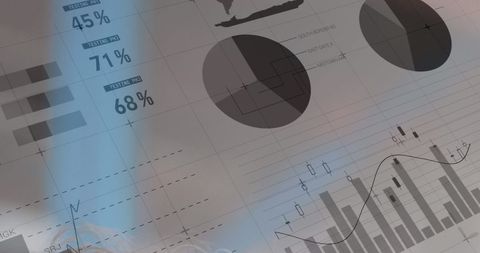
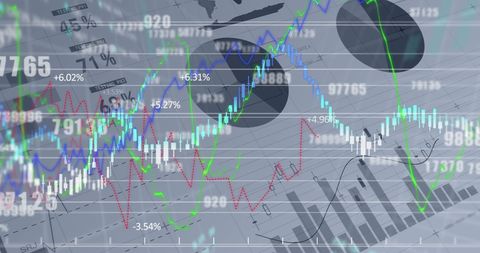
- Data Processing Overlay on Digital Charts
Data Processing Overlay on Digital Charts Image
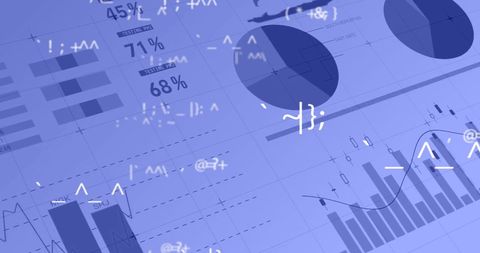
Abstract representation of data processing overlaid on charts and graphs conveys themes of business analytics and technology integration. Ideal for illustrating concepts of financial analysis, digital data interpretation, and modern communication networks. Useful for presentations, reports, and promotional materials related to data-driven decision-making and technological innovations.
Powered by  - Get 15% off with code: PIKWIZARD15


downloads
Tags:
More
Credit Photo
If you would like to credit the Photo, here are some ways you can do so
Text Link
photo Link
<span class="text-link">
<span>
<a target="_blank" href=https://pikwizard.com/photo/data-processing-overlay-on-digital-charts/c601c7bbeed66eaed89f57f961d560af/>PikWizard</a>
</span>
</span>
<span class="image-link">
<span
style="margin: 0 0 20px 0; display: inline-block; vertical-align: middle; width: 100%;"
>
<a
target="_blank"
href="https://pikwizard.com/photo/data-processing-overlay-on-digital-charts/c601c7bbeed66eaed89f57f961d560af/"
style="text-decoration: none; font-size: 10px; margin: 0;"
>
<img src="https://pikwizard.com/pw/medium/c601c7bbeed66eaed89f57f961d560af.jpg" style="margin: 0; width: 100%;" alt="" />
<p style="font-size: 12px; margin: 0;">PikWizard</p>
</a>
</span>
</span>
Free (free of charge)
Free for personal and commercial use.
Author: Authentic Images
Similar Free Stock Images

Premium


Premium


Premium

Premium


Premium


Premium


Premium


Premium
Premium

Premium


Premium


Premium


Premium


Premium


Premium


Premium


Premium


Premium


Premium


Premium


Premium

Premium


Premium


Premium


Premium


Explore More Free Stock Images